
👋 Bhupendra Rawat
Stock Market Data Analyst | Programming Enthusiast | 4+ Years of Experience
Empowering insights with data & code🔍 Expertise:
- Fundamental & Technical Analysis
- Python & Pandas for Stock Data
- Interactive Financial Dashboards
- JavaScript & Chart.js Visualization
🔄 Last Updated: Analysis Based on Data Till 4 August 2025
🚀 SJVN Share Price Target 2025–2026: A Strategic Power Play in India’s Renewable Energy Push?
SJVN, a public sector undertaking in the power generation space, is evolving into a major force in India’s green energy transformation. With a diversified portfolio spanning hydro, solar, wind, and thermal, SJVN is aligning with the nation’s clean energy goals.
The share price outlook for SJVN by 2025–26 is likely to be influenced by:
Strong pipeline of solar and hydro power projects
Government’s push for 500 GW renewable capacity by 2030
Consistent growth in top-line and operational cash flows
Improved return ratios and balance sheet expansion
Increased budget allocation for renewable infrastructure
As India accelerates its energy transition, SJVN is well-positioned to benefit from both public and private sector demand. However, project delays and rising capital expenditure could pose short-term challenges.
SJVN is emerging as a strategic long-term play in India’s power and utilities sector. If execution stays on schedule and financials remain robust, the stock could deliver steady value appreciation through 2025–26 and beyond.
✅ 2026 Target View – SJVN:
If renewable project execution slows down, order inflow weakens, or capital expenditure and debt levels rise, SJVN’s stock may correct to around ₹75.
However, if government energy investments rise, project execution improves, and returns strengthen, the stock could rally to ₹130 or higher.
📉 Downside Risk: ₹75 (approx. -19%)
📈 Upside Potential: ₹130 (approx. +41%)
🔎 Note:
Stock price targets are projections, not guarantees. These estimates are based on SJVN’s financial performance, project pipeline, technical trends, sector outlook, and government policy direction.
📊 For Short-Term / Intraday Traders:
If you want daily trading levels, live analysis, and intraday strategies for SJVN and other stocks —
join our free Telegram group, where you get professional-level market insights and trading guidance every day.
📊 SJVN Financial Overview (2021–2025)
📊 SJVN Fundamental Analysis: Is This PSU Power Stock a Long-Term Play?
SJVN (Satluj Jal Vidyut Nigam), a government-owned power utility company, has a diverse energy portfolio spanning hydro, thermal, and renewable energy. Let’s analyze its key financial performance from FY2021 to FY2025 to assess its long-term investment potential.
🔸 Revenue & Growth (CAGR: 5.44%)
While SJVN’s revenue has been stable, growth has been inconsistent due to regulatory factors and project timelines.
| Year | Revenue (₹ Cr) | Growth (%) |
|---|---|---|
| 2021 | 2485.39 | — |
| 2022 | 2417.00 | -2.75% |
| 2023 | 2938.35 | +21.57% |
| 2024 | 2579.37 | -12.22% |
| 2025 | 3072.01 | +19.10% |
📈 FY25 rebound shows recovery and possible capacity addition impact.
🔸 Net Profit & Margins
Net profit has declined from FY21 highs, with margin contraction indicating rising costs or lower pricing power.
| Year | Net Profit (₹ Cr) | Margin (%) |
|---|---|---|
| 2021 | 1641.78 | 66.06% |
| 2022 | 985.31 | 40.77% |
| 2023 | 1355.05 | 46.12% |
| 2024 | 907.25 | 35.17% |
| 2025 | 812.32 | 26.44% |
📉 Margins are shrinking—monitor expense control and revenue mix.
🔸 Earnings Per Share (EPS) Growth
EPS has remained flat or declined due to pressure on profit.
| Year | EPS (₹) | Growth (%) |
|---|---|---|
| 2021 | 4 | — |
| 2022 | 3 | -25.00% |
| 2023 | 3 | 0.00% |
| 2024 | 2 | -33.33% |
| 2025 | 2 | 0.00% |
⚠️ EPS stagnation indicates earnings dilution or margin pressure.
🔸 Return on Equity (ROE)
ROE has been falling—reflecting weaker profitability despite stable equity.
| Year | Net Profit (₹ Cr) | Avg. Equity (₹ Cr) | ROE (%) |
|---|---|---|---|
| 2021 | 1641.78 | — | — |
| 2022 | 985.31 | 12980.76 | 7.59% |
| 2023 | 1355.05 | 13514.94 | 10.03% |
| 2024 | 907.25 | 13965.20 | 6.50% |
| 2025 | 812.32 | 14124.75 | 5.75% |
📉 Declining ROE indicates reduced efficiency in using shareholder capital.
🔸 Debt-to-Equity Ratio
Debt levels have surged over five years, raising leverage concerns.
| Year | Total Debt (₹ Cr) | Shareholders’ Funds (₹ Cr) | D/E Ratio |
|---|---|---|---|
| 2021 | 4682.00 | 12791.18 | 0.37 |
| 2022 | 10078.10 | 13170.34 | 0.77 |
| 2023 | 18451.46 | 13859.54 | 1.33 |
| 2024 | 25120.40 | 14070.85 | 1.79 |
| 2025 | 31873.82 | 14178.65 | 2.25 |
⚠️ D/E over 2 is high for a PSU; expansion-funded growth must deliver returns.
🔸 Liquidity Ratios
SJVN maintains a healthy liquidity position for working capital needs.
| Year | Current Ratio | Quick Ratio |
|---|---|---|
| 2021 | 1.72 | 1.54 |
| 2022 | 1.45 | 1.93 |
| 2023 | 1.36 | 1.70 |
| 2024 | 1.37 | 1.58 |
| 2025 | 1.25 | 1.52 |
✅ Ratios above 1 indicate manageable short-term obligations.
🔸 Interest Coverage Ratio (ICR)
SJVN’s ICR has weakened, suggesting lower cushion for interest expenses.
| Year | Interest Coverage Ratio |
|---|---|
| 2021 | -751.95 (exceptional) |
| 2022 | 9.54 |
| 2023 | 5.25 |
| 2024 | 3.41 |
| 2025 | 2.49 |
⚠️ Deteriorating ICR is a risk if earnings don’t grow or interest costs rise.
🔸 Return on Capital Employed (ROCE)
ROCE has nearly halved, reflecting weaker operational efficiency.
| Year | ROCE (%) |
|---|---|
| 2021 | 14.63 |
| 2022 | 7.96 |
| 2023 | 8.03 |
| 2024 | 4.61 |
| 2025 | 4.57 |
📉 Low ROCE at current levels may not justify capital-heavy projects.
✅ Conclusion: Stable PSU With Debt-Driven Expansion
Strengths:
Diversified renewable & hydro power portfolio
Govt backing ensures stable operations
Healthy liquidity ratios
Risks:
Declining profit margins and ROE
Rising debt and weakening coverage ratios
Capital intensity may pressure returns
📌 Verdict: SJVN offers stable cash flows, but financial trends suggest cautious optimism. Long-term investors should monitor project execution, debt control, and margin recovery.
📈SJVN Technical Analysis: Price Charts, Trends & Potential Movements
Here, we analyze price action, support/resistance levels, moving averages, RSI, MACD, and other indicators to forecast near- and long-term movements.
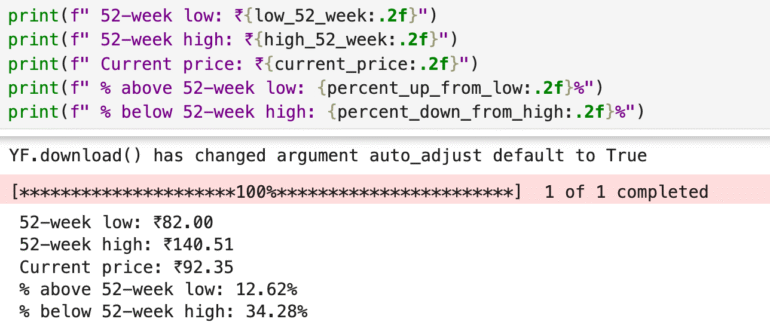
📈 SJVN 52-Week Price Performance Snapshot
52-Week Low: ₹82.00
52-Week High: ₹140.51
Current Market Price: ₹92.35
SJVN’s stock is currently 12.62% above its 52-week low, indicating a modest recovery from recent lows. However, it still trades 34.28% below its 52-week high, suggesting there’s considerable room for upside if market sentiment improves.
📊 Interpretation:
This price range suggests that SJVN is still in a consolidation or correction phase after peaking earlier. Investors may see this as a value-buying zone, particularly if future power sector reforms, green energy initiatives, and project execution pick up pace.
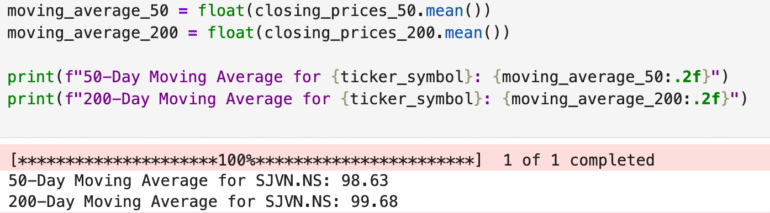
📊 SJVN Moving Averages Analysis
50-Day Moving Average (MA): ₹98.63
200-Day Moving Average (MA): ₹99.68
Current Market Price (CMP): ₹[Insert Latest Price]
📉 Technical Insight:
SJVN’s current price is below both the 50-day and 200-day moving averages.
➡️ This suggests short-term and long-term weakness in the stock.
➡️ Staying below the 50-DMA indicates bearish sentiment in the near term.
➡️ A move above the 200-DMA would be a bullish reversal signal for long-term investors.
📌 Conclusion:
SJVN appears to be in a consolidation or downtrend phase. Traders may avoid fresh long positions until the stock reclaims the 50-DMA. Long-term investors should watch for a sustained breakout above the 200-DMA to confirm a trend reversal.
🔍 Competitor Analysis: How SJVN Stacks Up
While SJVN is emerging as a key public sector player in India’s clean energy transformation—focused on hydro, solar, and wind—it’s essential to compare it with major peers in the power sector:
Power Grid Share Price Target 2025 – A stable, government-backed transmission giant known for steady returns and low volatility.
Adani Power Share Price Target 2025 – A high-growth private thermal power player benefiting from rising demand and operational efficiency.
NTPC Share Price Target 2025 – India’s largest power producer with strong fundamentals, renewable energy expansion, and consistent dividend payouts.
✅ Comparing these companies helps investors evaluate where SJVN fits in terms of clean energy potential, government backing, and long-term growth opportunities in India’s evolving power sector.