
👋 Bhupendra Rawat
Stock Market Data Analyst | Programming Enthusiast | 4+ Years of Experience
Empowering insights with data & code🔍 Expertise:
- Fundamental & Technical Analysis
- Python & Pandas for Stock Data
- Interactive Financial Dashboards
- JavaScript & Chart.js Visualization
🔄 Last Updated: Analysis Based on Data Till 5 August 2025
⚡ Power Grid Share Price Target 2025–2026: Backbone of India’s Power Infrastructure with Long-Term Strength?
Power Grid Corporation of India (PGCIL), the country’s leading power transmission PSU, forms the critical backbone of India’s electricity grid. With a nationwide network and robust financials, Power Grid is central to India’s mission of 24×7 reliable power.
The share price outlook for Power Grid by 2025–26 will likely be influenced by:
Expansion of transmission infrastructure for renewable integration
Increasing capex for grid modernization and smart systems
Consistent operational cash flows and profit margins
Healthy return ratios with improving interest coverage
Government’s thrust on power reforms and electrification
As renewable energy capacity rises, Power Grid’s role in connecting these sources to consumers becomes even more vital. While regulatory tariffs and rising capital costs may pose short-term pressures, its asset-light growth model and predictable revenue make it resilient.
Power Grid remains a core holding for investors seeking stability, dividends, and long-term visibility. If policy support and grid demand continue to align, the stock could see steady appreciation through 2025–26 and offer defensive strength in volatile markets.
✅ 2026 Target View – Power Grid:
If grid expansion slows, regulatory approvals get delayed, or rising interest costs pressure margins, Power Grid’s stock could dip toward ₹260.
However, if transmission demand surges, renewable integration accelerates, and financials remain strong, the stock could rise to ₹365 or more.
📉 Downside Risk: ₹260 (approx. -10%)
📈 Upside Potential: ₹365 (approx. +25%)
🔎 Note:
Stock price targets are indicative, not guaranteed. These estimates are based on Power Grid’s fundamentals, execution pipeline, sector outlook, and policy momentum within India’s evolving power ecosystem.
📊 For Short-Term / Intraday Traders:
If you want daily trading levels, live analysis, and intraday strategies for Power Grid and other stocks —
join our free Telegram group, where you get professional-level market insights and trading guidance every day.
⚡ Power Grid Financial Overview (2021–2025)
| Year | Revenue (₹ Cr) | Growth (%) | Net Profit (₹ Cr) | Margin (%) | EPS | EPS Growth (%) | ROE (%) | Shareholders' Funds (₹ Cr) | Total Debt (₹ Cr) | D/E Ratio |
|---|---|---|---|---|---|---|---|---|---|---|
| 2021 | 39639.79 | — | 11821.76 | 29.82 | 23 | — | — | 69936.07 | 185813.05 | 2.66 |
| 2022 | 41616.34 | 4.99 | 16745.60 | 40.24 | 24 | 4.35 | 22.91 | 76247.13 | 174696.30 | 2.29 |
| 2023 | 45581.28 | 9.53 | 15499.24 | 34.00 | 22 | -8.33 | 19.46 | 83014.51 | 167281.04 | 2.02 |
| 2024 | 45843.10 | 0.57 | 15592.71 | 34.01 | 17 | -22.73 | 18.33 | 87145.11 | 163745.41 | 1.88 |
| 2025 | 45792.32 | -0.11 | 15631.70 | 34.14 | 17 | 0.00 | 17.39 | 92662.81 | 173444.38 | 1.87 |
⚡ Power Grid Corporation of India 📊 Fundamental Analysis: Is This Transmission Titan a Long-Term Winner?
Power Grid Corporation of India, India’s leading power transmission PSU, plays a critical role in maintaining the national grid and ensuring reliable power delivery across the country. Let’s examine its financial performance from FY2021 to FY2025 to evaluate its long-term investment potential.
🔸 Revenue & Growth (CAGR: 3.67%)
Power Grid has posted modest but steady revenue growth, reflecting stable demand and regulated returns from its transmission projects.
| Year | Revenue (₹ Cr) | Growth (%) |
|---|---|---|
| 2021 | 39,639.79 | — |
| 2022 | 41,616.34 | +4.99% |
| 2023 | 45,581.28 | +9.53% |
| 2024 | 45,843.10 | +0.57% |
| 2025 | 45,792.32 | -0.11% |
📈 Revenue CAGR is low, but this is typical for regulated utilities focused on stability over rapid expansion.
🔸 Net Profit & Margins
Margins remain robust, supported by consistent regulated returns and operating efficiency.
| Year | Net Profit (₹ Cr) | Margin (%) |
|---|---|---|
| 2021 | 11,821.76 | 29.82% |
| 2022 | 16,745.60 | 40.24% |
| 2023 | 15,499.24 | 34.00% |
| 2024 | 15,592.71 | 34.01% |
| 2025 | 15,631.70 | 34.14% |
💡 Margins remain strong despite flat revenue growth—a hallmark of regulated asset-heavy PSUs.
🔸 Earnings Per Share (EPS) Growth
EPS trend reflects stable earnings performance, with minor fluctuations.
| Year | EPS (₹) | Growth (%) |
|---|---|---|
| 2021 | 23 | — |
| 2022 | 24 | +4.35% |
| 2023 | 22 | -8.33% |
| 2024 | 17 | -22.73% |
| 2025 | 17 | 0.00% |
⚠️ EPS dip post-FY23 reflects equity dilution and marginal profit growth.
🔸 Return on Equity (ROE)
Power Grid has delivered strong and improving ROE, indicating efficient capital use.
| Year | Net Profit (₹ Cr) | Avg. Equity (₹ Cr) | ROE (%) |
|---|---|---|---|
| 2021 | 11,821.76 | — | — |
| 2022 | 16,745.60 | 73,091.60 | 22.91% |
| 2023 | 15,499.24 | 79,630.82 | 19.46% |
| 2024 | 15,592.71 | 85,079.81 | 18.33% |
| 2025 | 15,631.70 | 89,903.96 | 17.39% |
📊 ROE remains high for a PSU, reflecting steady return on invested capital.
🔸 Debt-to-Equity Ratio
The D/E ratio has improved significantly, pointing to strong deleveraging.
| Year | Total Debt (₹ Cr) | Shareholders’ Funds (₹ Cr) | D/E Ratio |
|---|---|---|---|
| 2021 | 1,85,813.05 | 69,936.07 | 2.66 |
| 2022 | 1,74,696.30 | 76,247.13 | 2.29 |
| 2023 | 1,67,281.04 | 83,014.51 | 2.02 |
| 2024 | 1,63,745.41 | 87,145.11 | 1.88 |
| 2025 | 1,73,444.38 | 92,662.81 | 1.87 |
⚠️ D/E remains on the higher side but is improving gradually—positive for future financial flexibility.
🔸 Liquidity Ratios
Liquidity is moderate, with current ratio below 1 but improving quick ratio.
| Year | Current Ratio | Quick Ratio |
|---|---|---|
| 2021 | — | — |
| 2022 | 0.53 | 1.03 |
| 2023 | 0.72 | 1.14 |
| 2024 | 0.66 | 1.22 |
| 2025 | 0.67 | 1.30 |
📌 Current ratio <1 is common in capital-intensive PSUs, but quick ratio shows asset liquidity remains intact.
🔸 Interest Coverage Ratio (ICR)
ICR reflects strong ability to meet interest obligations from operating earnings.
| Year | Interest Coverage Ratio |
|---|---|
| 2021 | 2.97 |
| 2022 | 3.08 |
| 2023 | 2.82 |
| 2024 | 3.18 |
| 2025 | 3.20 |
✅ ICR > 2.5 signals strong creditworthiness and repayment capacity.
🔸 Return on Capital Employed (ROCE)
ROCE is consistent around 12%—solid for a regulated transmission player.
| Year | ROCE (%) |
|---|---|
| 2021 | 12.01 |
| 2022 | 11.74 |
| 2023 | 12.96 |
| 2024 | 13.23 |
| 2025 | 12.44 |
🔁 ROCE consistency indicates reliable capital efficiency in fixed infrastructure.
✅ Conclusion: A Stable Transmission Backbone with Predictable Returns
Strengths:
Consistent profits and high margins
Strong ROE and stable ROCE
Improving debt metrics
Regulated business ensures predictable returns
Critical role in national infrastructure
Risks:
Low revenue growth compared to generation companies like NTPC
High debt, though improving
Limited upside due to regulated pricing model
📌 Verdict: Power Grid is a financially sound, government-backed utility offering stability, dividends, and low volatility. A solid choice for long-term, conservative investors seeking steady returns from India’s growing energy infrastructure.
📈Power Grid Technical Analysis: Price Charts, Trends & Potential Movements
Here, we analyze price action, support/resistance levels, moving averages, RSI, MACD, and other indicators to forecast near- and long-term movements.
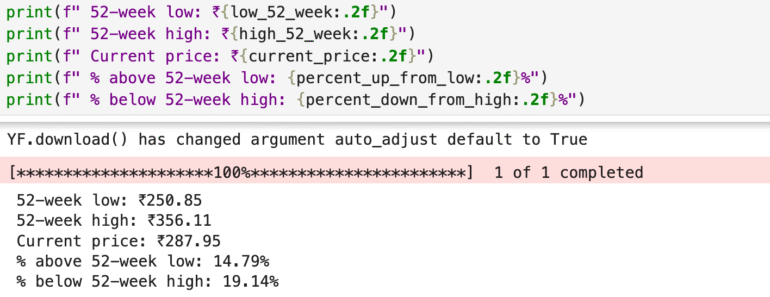
📈 Power Grid 52-Week Price Performance Snapshot
52-Week Low: ₹250.85
52-Week High: ₹356.11
Current Market Price: ₹287.95
Power Grid’s stock is currently 14.79% above its 52-week low, showing a decent rebound from support levels. However, it still trades 19.14% below its 52-week high, leaving room for potential upside as fundamentals strengthen.
📊 Interpretation:
The current price action suggests Power Grid may be in a correction or accumulation phase after peaking earlier this year. For long-term investors, this level might offer a risk-moderated entry point into a stable, dividend-yielding PSU with a monopoly in India’s transmission infrastructure.
With improving financials, steady ROE, and deleveraging trends, Power Grid remains a defensive play. However, closely tracking regulatory changes, interest rate movements, and capex efficiency will be crucial to gauge near-term price performance.
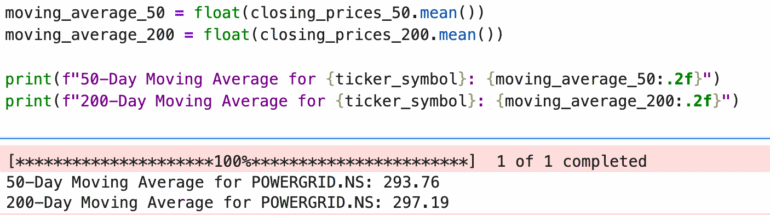
📊 Power Grid Moving Averages Analysis
50-Day Moving Average (MA): ₹293.76
200-Day Moving Average (MA): ₹297.19
Current Market Price (CMP): ₹287.95
📉 Technical Insight:
Power Grid’s current price is below both its 50-day and 200-day moving averages.
➡️ This suggests weakness in both the short-term and long-term price trends.
➡️ Trading below the 50-DMA indicates continued bearish sentiment in the near term.
➡️ A breakout above the 200-DMA would be an early bullish signal for long-term trend reversal.
📌 Conclusion:
Power Grid is currently in a technical downtrend. Traders may prefer to stay cautious until the stock reclaims the 50-DMA. For long-term investors, a sustained move above the 200-DMA could validate bullish momentum and mark a better entry point.
🔍 Competitor Analysis: How Power Grid Stacks Up
While Power Grid is India’s backbone in electricity transmission with stable returns and low volatility, it’s essential to compare it with other major power sector players:
NTPC Share Price Target 2025 – India’s largest power producer with a strong renewable push and consistent dividend history.
Adani Power Share Price Target 2025 – A fast-growing private thermal power company, showing strong earnings growth and operational efficiency.
SJVN Share Price Target 2025 – A government-owned hydro and renewable energy company aiming to scale clean power generation in India.
✅ Comparing these companies helps investors understand where Power Grid stands in terms of stability, defensive strength, and role in India’s energy infrastructure.