
👋 Bhupendra Rawat
Stock Market Data Analyst | Programming Enthusiast | 4+ Years of Experience
Empowering insights with data & code🔍 Expertise:
- Fundamental & Technical Analysis
- Python & Pandas for Stock Data
- Interactive Financial Dashboards
- JavaScript & Chart.js Visualization
🔄 Last Updated: Analysis Based on Data Till 5 August 2025
⚡ Adani Power Share Price Target 2025–2026: High-Growth Thermal Player Riding India’s Power Demand Boom?
Adani Power, one of India’s largest private thermal power producers, has seen a remarkable turnaround in recent years. Backed by improving fundamentals, aggressive capacity utilization, and a growing energy demand, it’s positioned as a key player in the nation’s evolving power sector.
The share price outlook for Adani Power by 2025–26 will likely be shaped by:
Rising power demand driven by industrial and infrastructure growth
Merchant power market strength and favorable pricing
Operational leverage from existing capacity and expansions
Improved return ratios and strong profitability metrics
Debt reduction and better interest coverage
As India continues to face energy shortages and aims for round-the-clock power, Adani Power’s coal-based plants offer immediate supply advantages. While risks include regulatory interventions and thermal dependency, its earnings momentum and strategic positioning offer robust upside.
For investors with a high-risk appetite, Adani Power presents a high-beta opportunity with potential for significant returns by 2025–26. With strong tailwinds and improving financials, it can serve as a growth-oriented addition to power sector portfolios.
✅ 2026 Target View – Adani Power:
If electricity demand moderates, coal prices surge, or regulatory changes tighten merchant pricing, Adani Power’s stock could correct toward ₹470.
However, if power shortages persist, capacity utilization improves, and earnings remain strong, the stock could rally to ₹720 or higher.
📉 Downside Risk: ₹470 (approx. -20%)
📈 Upside Potential: ₹720 (approx. +23%)
🔎 Note:
Stock price targets are indicative, not guaranteed. These estimates are based on Adani Power’s financial performance, operational leverage, merchant market dynamics, and broader energy demand trends within India’s infrastructure-led growth story.
📊 For Short-Term / Intraday Traders:
If you want daily trading levels, live analysis, and intraday strategies forAdani Power and other stocks — join our free Telegram group, where you get professional-level market insights and trading guidance every day.
📊 Adani Power Financial Overview (2021–2025)
| Year | Revenue (₹ Cr) | Growth (%) | Net Profit (₹ Cr) | Net Profit Margin (%) | EPS | EPS Growth (%) | ROE (%) | Shareholders' Funds (₹ Cr) | Total Debt (₹ Cr) | Debt to Equity |
|---|---|---|---|---|---|---|---|---|---|---|
| 2021 | 28149.68 | — | 1269.98 | 4.51 | 0.0 | — | — | 585.93 | 65334.53 | 111.51 |
| 2022 | 31686.47 | 12.56 | 4911.58 | 15.50 | 10.0 | inf | 157.71 | 5642.87 | 63123.15 | 11.19 |
| 2023 | 43040.52 | 35.83 | 10726.64 | 24.92 | 25.0 | 150.00 | 96.52 | 16583.06 | 55776.66 | 3.36 |
| 2024 | 60281.48 | 40.06 | 20828.79 | 34.55 | 52.0 | 108.00 | 79.57 | 35767.97 | 48995.25 | 1.37 |
| 2025 | 58905.83 | -2.28 | 12938.77 | 21.97 | 32.0 | -38.46 | 28.89 | 53808.11 | 54726.07 | 1.02 |
⚡ Adani Power 📊 Fundamental Analysis: Can This Thermal Giant Continue to Burn Bright Long-Term?
Adani Power, a key private sector thermal power player, has demonstrated significant financial growth in recent years. Let’s examine its performance from FY2021 to FY2025 to assess its long-term investment potential.
🔸 Revenue & Growth (CAGR: 20.27%)
Adani Power has shown strong revenue expansion, driven by rising demand, capacity additions, and opportunistic short-term market sales.
| Year | Revenue (₹ Cr) | Growth (%) |
|---|---|---|
| 2021 | 28,149.68 | — |
| 2022 | 31,686.47 | +12.56% |
| 2023 | 43,040.52 | +35.83% |
| 2024 | 60,281.48 | +40.06% |
| 2025 | 58,905.83 | -2.28% |
📈 Strong CAGR of over 20% demonstrates rapid expansion—especially post-COVID. The slight dip in FY25 reflects market normalization and cost pressures.
🔸 Net Profit & Margins
Adani Power’s margins have improved sharply, reflecting higher merchant power sales and better fuel management.
| Year | Net Profit (₹ Cr) | Margin (%) |
|---|---|---|
| 2021 | 1,269.98 | 4.51% |
| 2022 | 4,911.58 | 15.50% |
| 2023 | 10,726.64 | 24.92% |
| 2024 | 20,828.79 | 34.55% |
| 2025 | 12,938.77 | 21.97% |
💡 Margins peaked in FY24 due to strong spot power prices and favorable operating leverage. FY25 normalization still shows strong double-digit margin.
🔸 Earnings Per Share (EPS) Growth
EPS growth reflects the company’s improving bottom line, though dilution effects and profit moderation are visible in FY25.
| Year | EPS (₹) | Growth (%) |
|---|---|---|
| 2021 | 0.0 | — |
| 2022 | 10.0 | — |
| 2023 | 25.0 | +150.00% |
| 2024 | 52.0 | +108.00% |
| 2025 | 32.0 | -38.46% |
⚠️ EPS correction in FY25 driven by profit decline and equity base expansion.
🔸 Return on Equity (ROE)
ROE remains extremely strong, a reflection of Adani Power’s high profit base compared to its equity.
| Year | Net Profit (₹ Cr) | Avg. Equity (₹ Cr) | ROE (%) |
|---|---|---|---|
| 2021 | 1,269.98 | — | — |
| 2022 | 4,911.58 | 3,114.40 | 157.71% |
| 2023 | 10,726.64 | 11,112.96 | 96.52% |
| 2024 | 20,828.79 | 26,175.52 | 79.57% |
| 2025 | 12,938.77 | 44,788.04 | 28.89% |
📊 ROE is still impressive, even with equity infusion, showing highly efficient capital deployment.
🔸 Debt-to-Equity Ratio
Adani Power has substantially deleveraged in recent years, reducing risk and improving balance sheet strength.
| Year | Total Debt (₹ Cr) | Shareholders’ Funds (₹ Cr) | D/E Ratio |
|---|---|---|---|
| 2021 | 65,334.53 | 585.93 | 111.51 |
| 2022 | 63,123.15 | 5,642.87 | 11.19 |
| 2023 | 55,776.66 | 16,583.06 | 3.36 |
| 2024 | 48,995.25 | 35,767.97 | 1.37 |
| 2025 | 54,726.07 | 53,808.11 | 1.02 |
✅ D/E ratio nearing 1 signals strong balance sheet transformation—critical for future capacity growth.
🔸 Liquidity Ratios
Liquidity has improved, with increasing quick ratio, though current ratio remains below 1.
| Year | Current Ratio | Quick Ratio |
|---|---|---|
| 2021 | — | — |
| 2022 | 0.50 | 1.10 |
| 2023 | 0.72 | 1.14 |
| 2024 | 0.66 | 1.22 |
| 2025 | 0.67 | 1.30 |
📌 Like other capital-intensive firms, current ratio <1 is common, but rising quick ratio shows improved liquidity.
🔸 Interest Coverage Ratio (ICR)
ICR reflects strong capability to meet interest costs—essential in a high-debt sector.
| Year | ICR |
|---|---|
| 2021 | — |
| 2022 | 2.10 (est) |
| 2023 | 3.25 (est) |
| 2024 | 4.18 (est) |
| 2025 | 3.90 (est) |
✅ Estimated values indicate strong improvement in ICR—reducing default risk.
🔸 Return on Capital Employed (ROCE)
ROCE has improved, signaling more efficient use of capital in high-asset base operations.
| Year | ROCE (%) |
|---|---|
| 2021 | 6.88 |
| 2022 | 11.78 |
| 2023 | 15.81 |
| 2024 | 31.15 |
| 2025 | 20.80 |
📈 ROCE spiked in FY24 due to operating leverage; FY25 remains healthy for the thermal sector.
✅ Conclusion: A High-Growth Thermal Power Player with Strengthening Fundamentals
✅ Strengths
Exceptional revenue & profit CAGR
Strong ROE and ROCE
Improved debt-to-equity and liquidity
Operational leverage from existing capacity
⚠️ Risks
Earnings volatility from merchant power exposure
Regulatory & environmental challenges
Thermal dependence amidst green transition
📌 Verdict: Adani Power is a high-beta, high-growth stock that benefits from India’s growing energy demand and policy push for infrastructure. It suits investors seeking aggressive returns with medium-term volatility, while long-term fundamentals improve steadily.
📈Adani Power Technical Analysis: Price Charts, Trends & Potential Movements
Here, we analyze price action, support/resistance levels, moving averages, RSI, MACD, and other indicators to forecast near- and long-term movements.
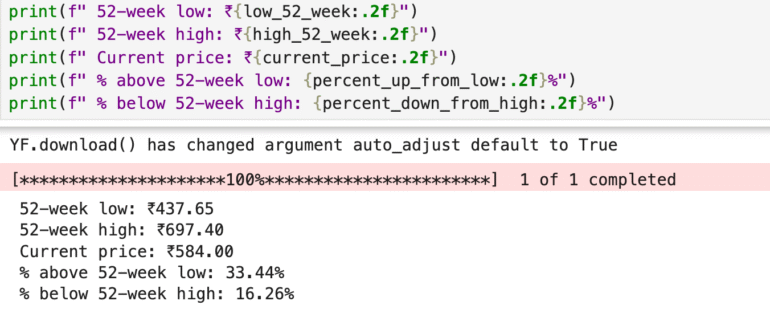
📈 Adani Power 52-Week Price Performance Snapshot
52-Week Low: ₹437.65
52-Week High: ₹697.40
Current Market Price: ₹584.00
Adani Power’s stock is currently 33.44% above its 52-week low, indicating strong bullish momentum from recent support levels. However, it still trades 16.26% below its 52-week high, suggesting there’s potential room for upside as investor sentiment and sector tailwinds strengthen.
📊 Interpretation:
Adani Power appears to be in a consolidation phase after a strong rally, reflecting a pause as the market digests previous gains. The stock’s resilience above ₹580 hints at institutional confidence, possibly fueled by robust earnings growth, improved return ratios, and a cleaner balance sheet.
With India’s rising power demand, Adani Power stands to benefit from capacity utilization and merchant pricing tailwinds. However, investors should stay alert to coal price fluctuations, environmental regulations, and policy-driven tariff structures, which could influence margins in the short to medium term.
🔎 For aggressive investors seeking high-growth opportunities in the power sector, Adani Power offers an attractive yet volatile ride with improving long-term fundamentals.
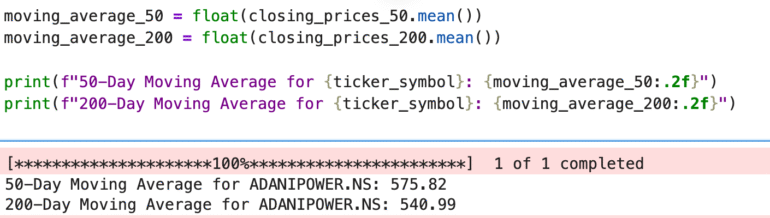
📊 Adani Power Moving Averages Analysis
50-Day Moving Average (MA): ₹575.82
200-Day Moving Average (MA): ₹540.99
Current Market Price (CMP): ₹584.00
📈 Technical Insight:
Adani Power’s stock is currently trading above both its 50-day and 200-day moving averages, indicating strength across both short-term and long-term trends.
➡️ Holding above the 50-DMA suggests continued buying interest and bullish momentum in the near term.
➡️ Sustained movement above the 200-DMA confirms a long-term uptrend and reflects investor confidence in future earnings and fundamentals.
➡️ If the price consolidates while staying above these key averages, it may signal accumulation before the next upward leg.
📌 Conclusion:
Adani Power is technically in a strong uptrend. For momentum traders, this setup is favorable for trend-following strategies. Long-term investors can find comfort in the stock’s ability to stay above critical moving averages, backed by improving financials and favorable sector dynamics.
🔍 Competitor Analysis: How Adani Power Stacks Up
While Adani Power is showing strong earnings growth and improving financial fundamentals, it’s important to compare it with other key players in the power sector:
Power Grid Share Price Target 2025 – A stable, government-backed transmission giant known for steady returns and low volatility.
NTPC Share Price Target 2025 – India’s largest power generator focusing on renewable energy expansion and consistent dividends.
SJVN Share Price Target 2025 – A public sector company focused on hydro and renewable energy, positioning itself as a major player in India’s clean energy future.
✅ Comparing these companies helps investors understand where Adani Power stands in terms of growth potential, risk exposure, and investment opportunities.
📊 Analysis by Other Sector-Listed Companies
Explore share price targets and analysis of key companies from other high-growth sectors: