
👋 Bhupendra Rawat
Stock Market Data Analyst | Programming Enthusiast | 4+ Years of Experience
Empowering insights with data & code🔍 Expertise:
- Fundamental & Technical Analysis
- Python & Pandas for Stock Data
- Interactive Financial Dashboards
- JavaScript & Chart.js Visualization
🔄 Last Updated: Analysis Based on Data Till 6August 2025
⚡ HAL Share Price Target 2025–2026: India’s Aerospace Champion Soaring High with Defence Momentum?
Hindustan Aeronautics Ltd (HAL), a leading defence PSU, has shown remarkable growth backed by India’s rising defence expenditure and indigenous manufacturing focus. With strong order inflows, robust execution, and Make in India tailwinds, HAL is cementing its role as a key pillar of the aerospace and defence ecosystem.
The share price outlook for HAL by 2025–26 will likely be driven by:
Increasing defence budgets and indigenous procurement
Strong order book visibility from major defence deals
Execution of large aerospace and helicopter projects
Solid financials with high ROCE and rising profitability
Growing global collaborations and export opportunities
As India pushes for self-reliance in defence, HAL’s manufacturing capacity, R&D capabilities, and project pipeline provide a structural long-term growth runway. While short-term volatility is possible, HAL’s fundamentals and leadership offer long-term value.
For investors seeking steady, high-quality defence sector exposure, HAL presents a strong and stable opportunity with long-term upside by 2025–26.
✅ 2026 Target View – HAL (Hindustan Aeronautics):
If order execution slows, geopolitical tensions rise, or defence capex stalls, HAL’s stock may correct toward ₹3,800.
However, if defence spending increases, export orders grow, and project execution remains strong, the stock could surge to ₹6,200 or higher by FY2026.
📉 Downside Risk: ₹3,800 (approx. -17%)
📈 Upside Potential: ₹6,200 (approx. +35%)
🔎 Note: These are indicative projections and depend on defence policies, execution strength, and global demand trends.
📊 For Short-Term / Intraday Traders:
If you want daily trading levels, live analysis, and intraday strategies for HAL and other stocks — join our free Telegram group, where you get professional-level market insights and trading guidance every day.
📊 HAL Financial Overview (2021–2025)
| Year | Revenue (₹ Cr) | Growth (%) | Net Profit (₹ Cr) | Net Profit Margin (%) | EPS | EPS Growth (%) | ROE (%) | Shareholders' Funds (₹ Cr) | Total Debt (₹ Cr) | Debt to Equity |
|---|---|---|---|---|---|---|---|---|---|---|
| 2021 | 23112.77 | — | 3239.46 | 14.02 | 97 | — | — | 15412.27 | 36529.72 | 2.37 |
| 2022 | 25604.95 | 10.78 | 5080.04 | 19.84 | 152 | 56.70 | 29.26 | 19313.13 | 39075.10 | 2.02 |
| 2023 | 28597.58 | 11.69 | 5827.74 | 20.38 | 174 | 14.47 | 27.18 | 23572.15 | 43627.91 | 1.85 |
| 2024 | 32277.68 | 12.87 | 7621.05 | 23.61 | 114 | -34.48 | 28.92 | 29138.17 | 48953.37 | 1.68 |
| 2025 | 33542.64 | 3.92 | 8364.13 | 24.94 | 125 | 9.65 | 26.09 | 34981.61 | 71281.68 | 2.04 |
✈️ Hindustan Aeronautics (HAL) 📊 Fundamental Analysis: Can This Defence Giant Maintain Its Steady Ascent?
Hindustan Aeronautics Ltd (HAL) is India’s premier aerospace and defence PSU with strong revenue visibility, consistent profitability, and solid financial ratios. Let’s analyze HAL’s performance from FY2021 to FY2025 to understand its long-term investment potential.
🔸 Revenue & Growth (CAGR: 9.76%)
HAL’s revenue growth has been steady, driven by defence contracts, exports, and modernization programs.
| Year | Revenue (₹ Cr) | Growth (%) |
|---|---|---|
| 2021 | 23,112.77 | — |
| 2022 | 25,604.95 | +10.78% |
| 2023 | 28,597.58 | +11.69% |
| 2024 | 32,277.68 | +12.87% |
| 2025 | 33,542.64 | +3.92% |
📈 9.76% CAGR reflects solid and consistent top-line growth, aligned with India’s defence needs.
🔸 Net Profit & Margins
HAL has shown strong profitability and improved margins, supported by efficient operations and cost control.
| Year | Net Profit (₹ Cr) | Net Profit Margin (%) |
|---|---|---|
| 2021 | 3,239.46 | 14.02% |
| 2022 | 5,080.04 | 19.84% |
| 2023 | 5,827.74 | 20.38% |
| 2024 | 7,621.05 | 23.61% |
| 2025 | 8,364.13 | 24.94% |
💡 Margins have consistently expanded — a sign of improved cost structure and project delivery efficiency.
🔸 Earnings Per Share (EPS) Growth
| Year | EPS (₹) | EPS Growth (%) |
|---|---|---|
| 2021 | 97 | — |
| 2022 | 152 | +56.70% |
| 2023 | 174 | +14.47% |
| 2024 | 114 | -34.48% |
| 2025 | 125 | +9.65% |
📌 EPS has grown overall, but FY24 showed a dip due to dilution or accounting factors. Recovery in FY25 indicates resilience.
🔸 Return on Equity (ROE)
| Year | Net Profit (₹ Cr) | Avg. Equity (₹ Cr) | ROE (%) |
|---|---|---|---|
| 2021 | 3,239.46 | — | — |
| 2022 | 5,080.04 | 17,362.70 | 29.26 |
| 2023 | 5,827.74 | 21,442.64 | 27.18 |
| 2024 | 7,621.05 | 26,355.16 | 28.92 |
| 2025 | 8,364.13 | 32,059.89 | 26.09 |
📈 Consistently above 25%, HAL’s ROE shows efficient capital deployment with strong shareholder returns.
🔸 Debt-to-Equity Ratio
| Year | Total Debt (₹ Cr) | Shareholders’ Funds (₹ Cr) | D/E Ratio |
|---|---|---|---|
| 2021 | 36,529.72 | 15,412.27 | 2.37 |
| 2022 | 39,075.10 | 19,313.13 | 2.02 |
| 2023 | 43,627.91 | 23,572.15 | 1.85 |
| 2024 | 48,953.37 | 29,138.17 | 1.68 |
| 2025 | 71,281.68 | 34,981.61 | 2.04 |
⚠️ While HAL operates with higher debt, this is manageable given the company’s secure cash flows and long-term defence contracts.
🔸 Liquidity Ratios
| Year | Current Ratio | Quick Ratio |
|---|---|---|
| 2021 | 1.13 | 0.68 |
| 2022 | 1.22 | 0.84 |
| 2023 | 1.31 | 1.00 |
| 2024 | 1.37 | 1.07 |
| 2025 | 1.33 | 1.00 |
✅ Strong liquidity position shows HAL’s ability to handle working capital and short-term obligations comfortably.
🔸 Return on Capital Employed (ROCE)
| Year | ROCE (%) |
|---|---|
| 2021 | 29.37 |
| 2022 | 27.35 |
| 2023 | 27.84 |
| 2024 | 35.11 |
| 2025 | 30.95 |
📊 ROCE continues to remain healthy and improving, reflecting better capital efficiency and project economics.
✅ Conclusion: A Stable Defence Giant with Consistent Fundamentals
✅ Strengths:
🔰 Government-backed monopoly in defence aviation
🚁 Strong order book with export opportunities
💰 Solid profitability and 25%+ ROE
📦 Strong liquidity and operational discipline
📈 Steady EPS and revenue growth
⚠️ Risks:
💸 High debt levels in recent years
⏳ Delays in defence procurement or policy changes
🌐 Export dependency and geopolitical risks
📌 Verdict:
HAL is a stable, long-term investment candidate in India’s strategic defence sector. Its strong fundamentals, expanding margins, and growing order book make it an attractive stock for investors seeking stable growth with moderate risk.
Ideal for:
🔵 Long-term investors
🔵 PSU-focused portfolios
🔵 Defence sector exposure
🔵 Dividend-seeking investors
📈HAL Technical Analysis: Price Charts, Trends & Potential Movements
Here, we analyze price action, support/resistance levels, moving averages, RSI, MACD, and other indicators to forecast near- and long-term movements.
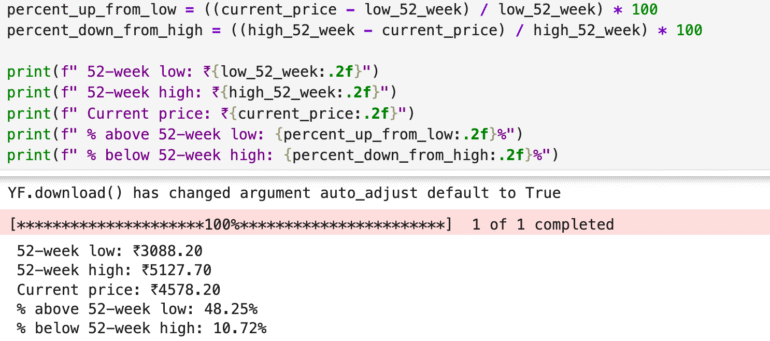
📈 HAL (Hindustan Aeronautics) 52-Week Price Performance Snapshot
52-Week Low: ₹3,088.20
52-Week High: ₹5,127.70
Current Market Price: ₹4,578.20
HAL is currently trading 48.25% above its 52-week low, showing strong bullish sentiment and sustained investor confidence. However, it is 10.72% below its 52-week high, indicating some recent profit-booking or consolidation.
📊 Interpretation:
The stock’s solid upward trend reflects robust fundamentals, strong order inflow, and defense sector tailwinds. Despite the slight pullback from its peak, HAL’s position remains resilient. Investors bullish on aerospace and defense innovation may view current levels as a consolidation phase before the next potential breakout, though short-term volatility cannot be ruled out.
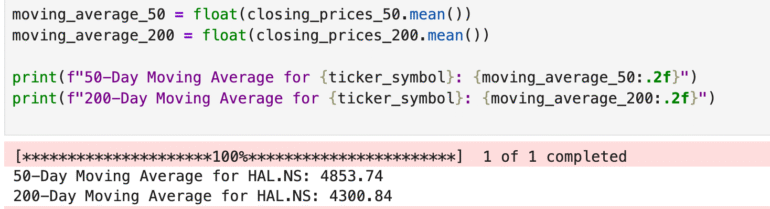
📊 HAL (Hindustan Aeronautics) – Moving Averages Analysis
50-Day Moving Average (MA): ₹4,853.74
200-Day Moving Average (MA): ₹4,300.84
Current Market Price (CMP): ₹4,578.20
📈 Technical Insight:
HAL’s stock is currently trading below its 50-day MA but above the 200-day MA, offering a mixed technical signal.
➡️ Trading below the 50-DMA indicates short-term buying momentum is weakening.
➡️ Staying above the 200-DMA suggests the long-term trend remains intact and bullish.
➡️ A move back above the 50-DMA could signal a bullish breakout and renewed upward momentum.
📌 Conclusion:
HAL appears to be in a technical consolidation phase. Traders should remain cautious until the stock reclaims the 50-DMA. Long-term investors, however, may find comfort in HAL’s strong fundamentals and sector leadership in defense and aerospace.
🔍 Competitor Analysis: How HAL Stands Among Peers
Hindustan Aeronautics Ltd. (HAL) is India’s premier aerospace and defence PSU, known for manufacturing fighter jets, helicopters, and aircraft systems. Backed by strong order books, Make in India initiatives, and rising exports, HAL remains a dominant player in defence aviation.
- BEL Share Price Target 2025–2026– Defence electronics giant; stable returns, strong margins.
- GRSE Share Price Target 2025–2026 – Navy shipbuilder; niche player in warships.
- BDL Share Price Target 2025–2026 – Missile expert; high-growth, export-ready.
✅ HAL stands out for its unmatched scale in aerospace, while BEL brings electronic stability, BDL leads missile tech, and GRSE anchors naval defence. Together, they reflect India’s expanding, diversified defence ecosystem.