Get real technical & fundamental analysis powered by Python – charts, codes, and results shared transparently.
📌 “Built with real-time tools, logic & market expertise.”

I use powerful Python libraries like pandas, yfinance, matplotlib, and TA-Lib to conduct deep stock analysis. From financial ratios to candlestick patterns – every insight is backed by code and logic.
✅ Balance Sheet, Profit & Loss
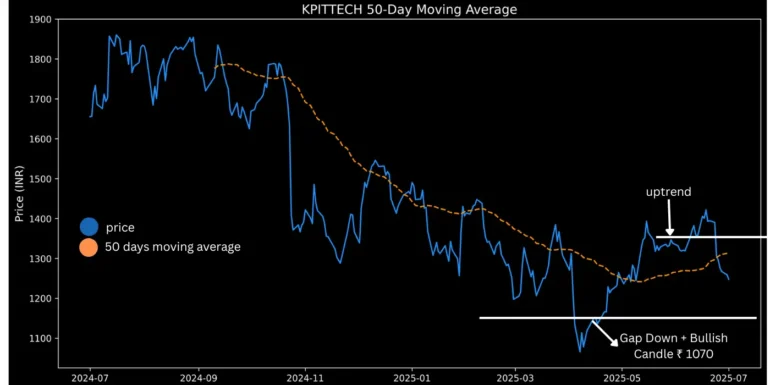
✅ Moving Averages, RSI, MACD
✅ Screener-based filtering
✅ Python script snapshots
✅ Output charts with highlights


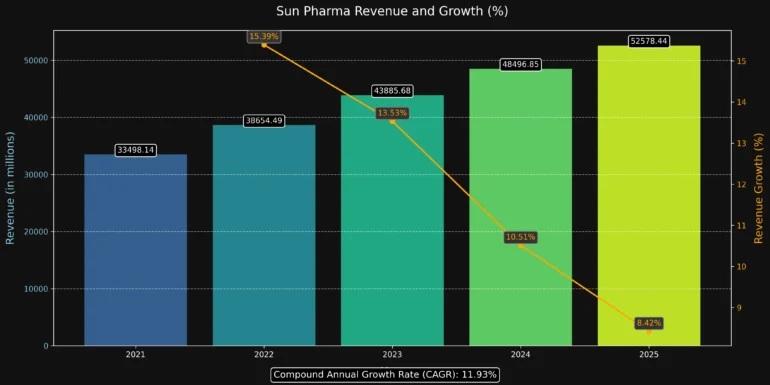
✔️ Revenue & Profit Trends
✔️ P/E Ratio, ROE, Debt-to-Equity
✔️ Quarterly Earnings & Balance Sheet
✔️ Growth Forecasting


✔️ Moving Averages, RSI, MACD
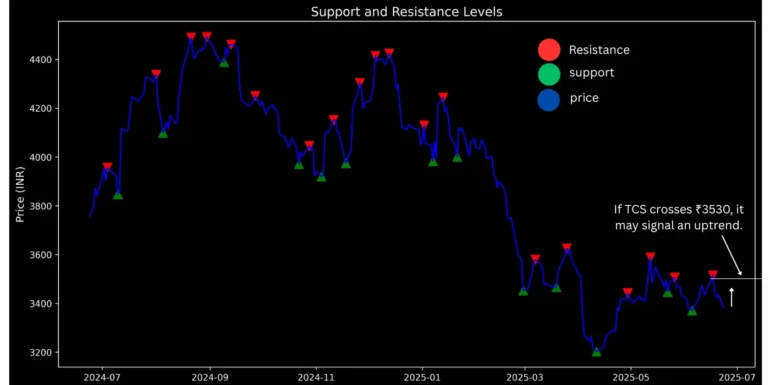
✔️ Trend Lines, Candlestick Patterns
✔️ Volume Analysis & Breakout Signals
✔️ Momentum-based screening


✅ Built using unbiased logic – not tips or rumors
✅ Transparent data sources (NSE, BSE, Yahoo Finance API)
✅ Easy-to-understand reports for beginners
✅ Advanced logic for traders & analysts
