
👋 Bhupendra Rawat
Stock Market Data Analyst | Programming Enthusiast | 4+ Years of Experience
Empowering insights with data & code🔍 Expertise:
- Fundamental & Technical Analysis
- Python & Pandas for Stock Data
- Interactive Financial Dashboards
- JavaScript & Chart.js Visualization
🔄 Last Updated: Analysis Based on Data Till 2 August 2025
🏗️ NBCC Share Price Target 2025–2026: A Smart Pick for Infrastructure Growth?
NBCC (India) Ltd, a Navratna PSU under the Ministry of Housing and Urban Affairs, plays a pivotal role in construction, real estate, and project management consultancy, especially for government-backed redevelopment projects.
The share price trajectory of NBCC by 2025–26 is expected to be influenced by:
Continued push for urban renewal and smart city projects
Execution of large-scale government redevelopment contracts
Expansion in international markets and EPC projects
Stable financials and improving profit margins
Analyst upgrades and improving order inflow
With a growing order book and strong backing from government initiatives like the Central Vista and smart city missions, NBCC holds long-term promise. However, the company’s execution speed and timely revenue realization will remain crucial factors.
Despite market volatility, NBCC’s strategic role in nation-building could make it a steady long-term play in India’s infrastructure story.
✅ 2026 Target View – NBCC:
If project delays, slow government approvals, or rising costs pressure margins, NBCC’s stock may fall to ₹90.
However, if smart city initiatives, government redevelopment plans, and infrastructure contracts progress smoothly, the stock could reach ₹140.
📉 Downside Risk: ₹90 (approx. -17%)
📈 Upside Potential: ₹140+
🔎 Note:
Stock price targets are indicative, not guaranteed. Analysts consider company fundamentals, order book, technical trends, and overall market sentiment while giving such projections.
📊 For Short-Term / Intraday Traders:
If you want daily trading levels, live analysis, and intraday strategies for NBCC and other stocks —
join our free Telegram group, where you get professional-level market insights and trading guidance every day.
🔄 Last Updated: Analysis Based on Data Till 1 August 2025
📊 NBCC Financial Overview (2021–2025)
📊 NBCC Fundamental Analysis: Evaluating the Core Strength of the Company
This section dives into revenue growth, net profit, EPS, ROE, debt-to-equity, and other key financial metrics to understand long-term stability.
🔸 Revenue & Growth
The company’s revenue has shown consistent growth over the past five years, rising from ₹6,832 Cr in 2021 to ₹12,039 Cr in 2025. The growth was especially strong in 2024, reflecting improved execution and project scale-up.
➡️ 2021: ₹6,832.07 Cr
➡️ 2022: ₹7,690.61 Cr (+12.57%)
➡️ 2023: ₹8,754.44 Cr (+13.83%)
➡️ 2024: ₹10,432.64 Cr (+19.17%)
➡️ 2025: ₹12,038.57 Cr (+15.39%)
📈 The company maintained a robust double-digit growth trajectory, indicating strong operational momentum and increasing order execution capacity.
🔸 Net Profit & Margins
Net profit has also seen steady improvement, with margins gradually rising — a sign of better cost control and efficiency gains over time.
➡️ 2021: ₹236.44 Cr (Margin: 3.46%)
➡️ 2022: ₹237.90 Cr (3.09%)
➡️ 2023: ₹277.02 Cr (3.16%)
➡️ 2024: ₹414.27 Cr (3.97%)
➡️ 2025: ₹557.47 Cr (4.63%)
💡 Margins are improving year after year, signaling a positive trend in profitability and value creation.
🔸 EPS & Growth
Earnings Per Share (EPS) remained flat from 2021 to 2023 but doubled in 2024 — suggesting a breakout year — and remained stable in 2025.
➡️ 2021: ₹1
➡️ 2022: ₹1 (0.0%)
➡️ 2023: ₹1 (0.0%)
➡️ 2024: ₹2 (+100%)
➡️ 2025: ₹2 (0.0%)
📊 EPS jump in 2024 reflects strong profit expansion. Stability in 2025 suggests consolidation after a breakout year.
🔸 Return on Equity (ROE)
ROE has improved steadily over the years, indicating efficient use of shareholder capital. The rise in FY25 especially highlights strong financial performance.
➡️ FY22: 13.97%
➡️ FY23: 14.92%
➡️ FY24: 19.87%
➡️ FY25: 23.7%
📈 Rising ROE is a strong indicator of value generation and attractive returns on equity investment.
🔸 Debt-to-Equity Ratio
The company’s leverage position has improved significantly, with the debt-to-equity ratio falling steadily — a very healthy sign for balance sheet strength.
➡️ FY21: 6.94
➡️ FY22: 6.51
➡️ FY23: 5.53
➡️ FY24: 4.66
➡️ FY25: 4.42
📉 The steady decline in debt-to-equity ratio indicates better financial discipline and lower risk.
📌 Conclusion
This company demonstrates strong fundamentals across key metrics — revenue, profit, EPS, and return ratios — with improving margins and a stronger balance sheet. FY24 and FY25 show impressive acceleration in profits and returns, making it a potential long-term investment candidate.
✅ Why it stands out:
Consistent revenue growth
Rising net margins and EPS
Strong ROE
Improving debt profile
If infrastructure growth continues in India, this company could sustain its upward trajectory through 2026 and beyond.
📈NBCC Technical Analysis: Price Charts, Trends & Potential Movements
Here, we analyze price action, support/resistance levels, moving averages, RSI, MACD, and other indicators to forecast near- and long-term movements.
📈 NBCC Share Performance Snapshot (2025)
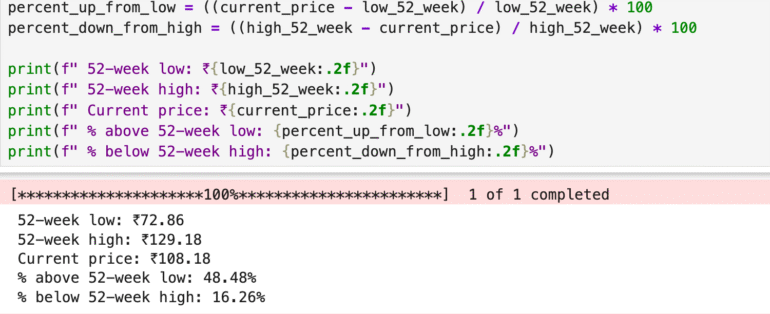
🔻 52-week Low: ₹72.86
🔺 52-week High: ₹129.18
📊 Current Price: ₹108.18
➡️ Above 52-week Low by: +48.48%
⬅️ Below 52-week High by: -16.26%
📌 This data shows that NBCC has recovered significantly from its 52-week low, gaining nearly 48%. Although it’s still 16% below its peak, the strong recovery suggests bullish sentiment. If order inflows and project execution continue improving, there could be further upside potential.
📉 NBCC Technical Overview (2025)
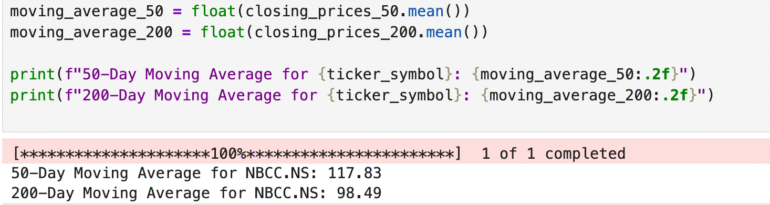
📊 Current Price: ₹108.18
📈 50-Day Moving Average (DMA): ₹117.83
📉 200-Day Moving Average (DMA): ₹98.49
🔍 Analysis:
The current price is below the 50-DMA (₹117.83), indicating short-term weakness or possible consolidation.
However, it is above the 200-DMA (₹98.49), which reflects a bullish long-term trend.
📌 Conclusion: While NBCC may be facing short-term resistance, its position above the 200-day average suggests continued investor confidence in the long-term. A breakout above the 50-DMA could signal renewed upward momentum.
🔍 Competitor Analysis: How NBCC Stacks Up
NBCC (India) Ltd., a government-owned Navratna enterprise, is known for its strength in project management consultancy (PMC), real estate redevelopment, and EPC works. With consistent government contracts, NBCC maintains a strong foothold in the construction and urban renewal space. Here’s how it compares with peers:
L&T Share Price Target 2025–2026 – India’s most diversified and large-scale infrastructure company with operations across heavy civil, defence, hydrocarbon, and global projects. Known for stable growth and strong balance sheet.
RVNL Share Price Target 2025–2026 – A specialized railway infrastructure PSU delivering consistent performance, backed by government contracts and a low-risk execution model.
✅ Comparing these players helps investors evaluate NBCC’s unique positioning in urban redevelopment and project management, particularly in government-led initiatives like CPWD and Smart Cities. It also highlights its low-capex model, strong PSU support, and moderate but steady growth potential compared to more diversified or sector-specific peers.