
🔄 Last Updated: Analysis Based on Data Till 2 August 2025
👋 Bhupendra Rawat
Stock Market Data Analyst | Programming Enthusiast | 4+ Years of Experience
Empowering insights with data & code🔍 Expertise:
- Fundamental & Technical Analysis
- Python & Pandas for Stock Data
- Interactive Financial Dashboards
- JavaScript & Chart.js Visualization
🚀 BDL Share Price Target 2025–2026: A Strategic Play in India’s Defence Growth?
Bharat Dynamics Ltd (BDL), a Mini-Ratna PSU under the Ministry of Defence, plays a crucial role in the production of missiles and strategic defence systems. As India focuses on indigenizing defence manufacturing under the ‘Atmanirbhar Bharat’ initiative, BDL stands out as a key beneficiary.
The share price outlook for BDL by 2025–26 is expected to be driven by:
Rising government defence capital expenditure
Strong order book for missile and weapon systems
Expansion into export markets and joint ventures
Operational efficiency and improved financial metrics
Consistent demand under ‘Make in India’ policy
With growing geopolitical focus and rising defence allocations, BDL is well-positioned for long-term growth. However, EPS volatility and execution pace remain watch points.
Despite near-term fluctuations, BDL’s strategic importance in India’s national security landscape could make it a reliable long-term bet for investors focused on the defence sector.
✅ 2026 Target View – BDL:
If defence order execution slows, export deals face delays, or profit margins remain under pressure, BDL’s stock may drop to around ₹1350.
However, if government defence spending increases, execution improves, and exports rise, the stock could climb to ₹2000 or more.
📉 Downside Risk: ₹1350 (approx. -14%)
📈 Upside Potential: ₹2000+
🔎 Note:
Stock price targets are estimates, not guarantees. Projections are based on company fundamentals, defence order pipeline, EPS trends, technical charts, and overall sector sentiment.
📊 For Short-Term / Intraday Traders:
If you want daily trading levels, live analysis, and intraday strategies for BDL and other stocks —
join our free Telegram group, where you get professional-level market insights and trading guidance every day.
📊 BDL Financial Overview (2021–2025)
Bharat Dynamics – Consolidated Financial Statements
| Particulars | Mar 25 | Mar 24 | Mar 23 | Mar 22 | Mar 21 |
|---|---|---|---|---|---|
| EQUITIES AND LIABILITIES | |||||
| Equity Share Capital | 183.28 | 183.28 | 183.28 | 183.28 | 183.28 |
| Total Share Capital | 183.28 | 183.28 | 183.28 | 183.28 | 183.28 |
| Reserves and Surplus | 3,825.67 | 3,453.54 | 3,028.22 | 2,847.28 | 2,501.47 |
| Total Reserves and Surplus | 3,825.67 | 3,453.54 | 3,028.22 | 2,847.28 | 2,501.47 |
| Total Shareholders Funds | 4,008.95 | 3,636.82 | 3,211.50 | 3,030.56 | 2,684.75 |
| NON-CURRENT LIABILITIES | |||||
| Other Long Term Liabilities | 3,372.93 | 3,697.07 | 3,254.60 | 907.61 | 726.97 |
| Long Term Provisions | 0.43 | 0.40 | 0.37 | 44.66 | 29.07 |
| Total Non-Current Liabilities | 3,373.36 | 3,697.47 | 3,254.97 | 952.27 | 756.04 |
| CURRENT LIABILITIES | |||||
| Trade Payables | 1,505.56 | 798.39 | 464.38 | 553.79 | 742.60 |
| Other Current Liabilities | 2,346.97 | 1,807.45 | 1,389.87 | 1,717.96 | 1,548.39 |
| Short Term Provisions | 507.64 | 399.92 | 351.72 | 309.31 | 229.98 |
| Total Current Liabilities | 4,360.17 | 3,005.76 | 2,205.97 | 2,581.06 | 2,520.97 |
| Total Capital And Liabilities | 11,742.48 | 10,340.05 | 8,672.43 | 6,563.88 | 5,961.76 |
| ASSETS | |||||
| Tangible Assets | 831.49 | 725.25 | 701.14 | 761.09 | 782.48 |
| Intangible Assets | 138.77 | 98.36 | 107.38 | 112.75 | 132.50 |
| Capital Work-In-Progress | 117.15 | 72.87 | 74.35 | 40.73 | 21.50 |
| Other Assets | 0.00 | 0.01 | 0.01 | 0.01 | 0.01 |
| Fixed Assets | 1,087.41 | 896.50 | 882.88 | 914.58 | 936.49 |
| Non-Current Investments | 3.91 | 0.00 | 0.00 | 0.00 | 4.52 |
| Deferred Tax Assets [Net] | 122.73 | 70.73 | 56.42 | 57.11 | 47.73 |
| Long Term Loans And Advances | 1.26 | 1.70 | 1.74 | 2.04 | 2.52 |
| Other Non-Current Assets | 149.26 | 132.11 | 131.25 | 66.92 | 71.50 |
| Total Non-Current Assets | 1,364.57 | 1,101.04 | 1,072.29 | 1,040.65 | 1,062.76 |
| CURRENT ASSETS | |||||
| Inventories | 2,645.11 | 1,982.47 | 1,822.44 | 1,654.45 | 1,397.01 |
| Trade Receivables | 826.36 | 310.45 | 184.57 | 304.16 | 322.69 |
| Cash And Cash Equivalents | 4,190.37 | 4,228.48 | 3,858.86 | 1,899.53 | 1,560.95 |
| Short Term Loans And Advances | 4.42 | 2.00 | 2.02 | 1.84 | 1.97 |
| Other Current Assets | 2,711.67 | 2,715.61 | 1,732.25 | 1,663.25 | 1,616.37 |
| Total Current Assets | 10,377.92 | 9,239.01 | 7,600.14 | 5,523.24 | 4,899.00 |
| Total Assets | 11,742.48 | 10,340.05 | 8,672.43 | 6,563.88 | 5,961.76 |
| OTHER ADDITIONAL INFORMATION | |||||
| Contingent Liabilities | 0.00 | 697.52 | 607.35 | 471.52 | 357.28 |
| Bonus Equity Share Capital | - | 116.08 | 116.08 | 116.08 | 116.08 |
| Non-Current Investments Quoted Market Value | - | - | - | - | - |
| Non-Current Investments Unquoted Book Value | - | - | - | - | 4.52 |
| Current Investments Quoted Market Value | - | - | - | - | - |
| Current Investments Unquoted Book Value | - | - | - | - | - |
| Particulars | Mar 25 | Mar 24 | Mar 23 | Mar 22 | Mar 21 |
|---|---|---|---|---|---|
| INCOME | |||||
| Revenue From Operations [Gross] | 3,323.07 | 2,350.58 | 2,469.03 | 2,817.40 | 1,913.76 |
| Revenue From Operations [Net] | 3,323.07 | 2,350.58 | 2,469.03 | 2,817.40 | 1,913.76 |
| Other Operating Revenues | 21.98 | 18.70 | 20.36 | 0.00 | 0.00 |
| Total Operating Revenues | 3,345.05 | 2,369.28 | 2,489.39 | 2,817.40 | 1,913.76 |
| Other Income | 350.40 | 361.83 | 155.40 | 111.21 | 94.61 |
| Total Revenue | 3,695.45 | 2,731.10 | 2,644.79 | 2,928.61 | 2,008.37 |
| EXPENSES | |||||
| Cost Of Materials Consumed | 2,099.76 | 1,108.41 | 1,206.09 | 1,263.37 | 970.08 |
| Operating And Direct Expenses | 0.00 | 11.55 | 4.25 | 0.00 | 0.00 |
| Changes In Inventories Of FG,WIP And Stock-In Trade | -421.86 | -222.63 | -19.04 | -84.36 | -128.91 |
| Employee Benefit Expenses | 548.80 | 600.01 | 532.46 | 570.66 | 501.09 |
| Finance Costs | 3.31 | 3.11 | 4.54 | 3.42 | 3.91 |
| Depreciation And Amortisation Expenses | 70.70 | 67.04 | 77.26 | 90.35 | 94.54 |
| Other Expenses | 645.99 | 335.39 | 357.44 | 341.66 | 226.78 |
| Total Expenses | 2,946.69 | 1,902.87 | 2,162.99 | 2,185.12 | 1,667.49 |
| PROFIT / LOSS | |||||
| Profit/Loss Before Exceptional, ExtraOrdinary Items And Tax | 748.76 | 828.24 | 481.80 | 743.50 | 340.88 |
| Exceptional Items | 0.00 | 0.00 | 0.00 | -33.59 | 0.00 |
| Profit/Loss Before Tax | 748.76 | 828.24 | 481.80 | 709.91 | 340.88 |
| Current Tax | 199.12 | 228.75 | 127.75 | 216.54 | 72.04 |
| Deferred Tax | 0.00 | -13.23 | 1.88 | -6.55 | 11.07 |
| Total Tax Expenses | 199.12 | 215.51 | 129.63 | 209.99 | 83.12 |
| Profit/Loss After Tax And Before ExtraOrdinary Items | 549.65 | 612.72 | 352.17 | 499.92 | 257.77 |
| Profit/Loss From Continuing Operations | 549.65 | 612.72 | 352.17 | 499.92 | 257.77 |
| Profit/Loss For The Period | 549.65 | 612.72 | 352.17 | 499.92 | 257.77 |
| OTHER ADDITIONAL INFORMATION | |||||
| Basic EPS (Rs.) | 14.99 | 33.43 | 19.22 | 27.28 | 14.06 |
| Diluted EPS (Rs.) | 14.99 | 33.43 | 19.22 | 27.28 | 14.06 |
| Equity Share Dividend | 0.00 | 184.20 | 167.70 | 145.71 | 169.54 |
| Equity Dividend Rate (%) | 93.00 | 106.00 | 94.00 | 83.00 | 74.00 |
| Particulars | Mar '25 | Mar '24 | Mar '23 | Mar '22 | Mar '21 |
|---|---|---|---|---|---|
| Investment Valuation Ratios | |||||
| Face Value | 5.00 | 10.00 | 10.00 | 10.00 | 10.00 |
| Dividend Per Share | 4.65 | 10.55 | 9.35 | 8.30 | 7.35 |
| Operating Profit Per Share (Rs) | 12.89 | 29.27 | 22.27 | 39.61 | 18.81 |
| Net Operating Profit Per Share (Rs) | 91.25 | 129.27 | 135.82 | 153.72 | 104.42 |
| Free Reserves Per Share (Rs) | -- | -- | -- | -- | -- |
| Bonus in Equity Capital | -- | 63.33 | 63.33 | 63.33 | 63.33 |
| Profitability Ratios | |||||
| Operating Profit Margin (%) | 14.12 | 22.64 | 16.39 | 25.77 | 18.01 |
| Profit Before Interest And Tax Margin (%) | 10.86 | 17.19 | 12.51 | 21.70 | 12.45 |
| Gross Profit Margin (%) | 12.00 | 19.81 | 13.29 | 22.56 | 13.07 |
| Cash Profit Margin (%) | 16.78 | 24.88 | 16.23 | 21.30 | 17.54 |
| Adjusted Cash Margin (%) | 16.78 | 24.88 | 16.23 | 21.30 | 17.54 |
| Net Profit Margin (%) | 16.43 | 25.86 | 14.14 | 17.74 | 13.46 |
| Adjusted Net Profit Margin (%) | 14.87 | 22.43 | 13.31 | 17.07 | 12.83 |
| Return On Capital Employed (%) | 18.75 | 22.85 | 15.14 | 24.64 | 12.84 |
| Return On Net Worth (%) | 13.71 | 16.84 | 10.96 | 16.49 | 9.60 |
| Adjusted Return on Net Worth (%) | 13.71 | 16.84 | 10.96 | 17.60 | 9.60 |
| Return on Assets Excluding Revaluations | 109.37 | 198.43 | 175.22 | 165.35 | 146.48 |
| Return on Assets Including Revaluations | 109.37 | 198.43 | 175.22 | 165.35 | 146.48 |
| Return on Long Term Funds (%) | 18.75 | 22.85 | 15.14 | 24.64 | 12.84 |
| Liquidity And Solvency Ratios | |||||
| Current Ratio | 1.38 | 1.41 | 1.43 | 1.60 | 1.53 |
| Quick Ratio | 1.02 | 1.10 | 1.08 | 1.11 | 1.09 |
| Debt Equity Ratio | -- | -- | -- | -- | -- |
| Long Term Debt Equity Ratio | -- | -- | -- | -- | -- |
| Debt Coverage Ratios | |||||
| Interest Cover | 227.27 | 267.73 | 107.21 | 218.12 | 88.12 |
| Total Debt to Owners Fund | -- | -- | -- | -- | -- |
| Financial Charges Coverage Ratio | 248.64 | 289.31 | 124.24 | 244.51 | 112.28 |
| Financial Charges Coverage Ratio Post Tax | 188.47 | 219.91 | 95.66 | 173.38 | 91.04 |
| Management Efficiency Ratios | |||||
| Inventory Turnover Ratio | 1.26 | 1.20 | 1.37 | 1.70 | 1.37 |
| Debtors Turnover Ratio | 5.89 | 9.57 | 10.19 | 8.99 | 5.79 |
| Investments Turnover Ratio | 0.83 | 0.65 | 0.78 | 0.93 | 0.71 |
| Fixed Assets Turnover Ratio | 3.08 | 1.93 | 2.25 | 2.44 | 1.73 |
| Total Assets Turnover Ratio | 0.83 | 0.67 | 0.80 | 0.97 | 0.75 |
| Asset Turnover Ratio | 0.88 | 0.69 | 0.80 | 0.99 | 0.72 |
| Profit & Loss Account Ratios | |||||
| Material Cost Composition (%) | 62.77 | 46.78 | 48.44 | 44.84 | 50.68 |
| Imported Composition of Raw Materials Consumed | -- | -- | -- | -- | -- |
| Selling Distribution Cost Composition | -- | 0.07 | 0.05 | 0.03 | 0.06 |
| Expenses as Composition of Total Sales | -- | -- | -- | -- | -- |
| Cash Flow Indicator Ratios | |||||
| Dividend Payout Ratio Net Profit | -- | 30.06 | 47.61 | 29.14 | 65.77 |
| Dividend Payout Ratio Cash Profit | -- | 27.09 | 39.05 | 24.68 | 48.12 |
| Earning Retention Ratio (%) | 100.00 | 69.94 | 52.39 | 72.69 | 34.23 |
| Cash Earning Retention Ratio (%) | 100.00 | 72.91 | 60.95 | 76.65 | 51.88 |
| Adjusted Cash Flow Times | -- | -- | -- | -- | -- |
| Additional Info | |||||
| Earnings Per Share (Rs) | 14.99 | 33.43 | 19.21 | 27.28 | 14.06 |
| Book Value (Rs) | 109.37 | 198.43 | 175.22 | 165.35 | 146.48 |
| Particulars | Mar '25 | Mar '24 | Mar '23 | Mar '22 | Mar '21 |
|---|---|---|---|---|---|
| Cash Flow (in Rs. Cr.) | |||||
| Net Profit Before Tax | 748.76 | 828.24 | 481.80 | 743.50 | 340.88 |
| Net Cash From Operating Activities | 167.39 | 411.72 | 2130.25 | 529.66 | 1068.01 |
| Net Cash (used in)/from Investing Activities | -407.13 | -722.40 | -1171.03 | -573.01 | -733.78 |
| Net Cash (used in)/from Financing Activities | -220.25 | -148.36 | -171.38 | -148.52 | -172.64 |
| Net (decrease)/increase In Cash and Cash Equivalents | -459.99 | -459.04 | 787.84 | -191.87 | 161.59 |
| Opening Cash & Cash Equivalents | 593.84 | 1052.88 | 265.04 | 456.92 | 295.33 |
| Closing Cash & Cash Equivalents | 133.86 | 593.84 | 1052.88 | 265.04 | 456.92 |
📊 BDL Fundamental Analysis: Evaluating the Core Strength of the Company
This section dives into revenue growth, net profit, EPS, ROE, debt-to-equity, and other key financial metrics to understand long-term stability.
🔸 Revenue & Growth
BDL’s revenue has seen fluctuations in recent years, reflecting the cyclical nature of defence orders. However, FY25 shows a strong recovery, suggesting improving execution and order inflow.
➡️ 2021: ₹1,913.76 Cr
➡️ 2022: ₹2,817.40 Cr (+47.22%)
➡️ 2023: ₹2,469.03 Cr (–12.36%)
➡️ 2024: ₹2,350.58 Cr (–4.80%)
➡️ 2025: ₹3,323.07 Cr (+41.37%)
📈 FY25 bounce-back indicates renewed growth momentum after two slower years.
🔸 Net Profit & Margins
Net profit and margins have remained strong, with FY24 seeing a notable jump in profitability. This indicates improved cost efficiency and high-margin order execution.
➡️ 2021: ₹257.77 Cr (Margin: 12.83%)
➡️ 2022: ₹499.92 Cr (17.07%)
➡️ 2023: ₹352.17 Cr (13.32%)
➡️ 2024: ₹612.72 Cr (22.43%)
➡️ 2025: ₹549.65 Cr (14.87%)
💡 FY24 stands out with exceptional margins, likely driven by high-value defense contracts.
🔸 EPS & Growth
Earnings Per Share (EPS) has been volatile, with strong growth in FY22 and FY24, but a notable dip in FY25 due to a lower profit base.
➡️ 2021: ₹14.06
➡️ 2022: ₹27.28 (+94.03%)
➡️ 2023: ₹19.22 (–29.55%)
➡️ 2024: ₹33.43 (+73.93%)
➡️ 2025: ₹14.99 (–55.16%)
📊 The decline in FY25 EPS requires monitoring but may normalize if order execution stabilizes.
🔸 Return on Equity (ROE)
ROE shows a dip in FY23, but rebounded in FY24. FY25 has softened slightly, possibly due to balance sheet expansion.
➡️ FY22: 17.49%
➡️ FY23: 11.28%
➡️ FY24: 17.89%
➡️ FY25: 14.38%
📉 While FY25 ROE is lower, it still reflects decent capital efficiency.
🔸 Debt-to-Equity Ratio
BDL’s debt-to-equity ratio has increased over the years but remains manageable. The rise reflects increased borrowings to support operations or Capex.
➡️ FY21: 1.22
➡️ FY22: 1.17
➡️ FY23: 1.70
➡️ FY24: 1.84
➡️ FY25: 1.93
⚠️ The rising leverage needs monitoring, though it is still within a reasonable range for PSU defence firms.
📌 Conclusion
BDL shows a solid financial foundation, especially in profit margins and EPS during strong years. However, EPS volatility and rising leverage suggest a need for cautious optimism.
✅ Why it stands out:
Strong operating margins
Government-backed order book
High EPS during key years
Critical role in India’s defense sector
If defence modernization and export opportunities expand, BDL could remain a promising strategic play through 2026 and beyond.
📈BDL Technical Analysis: Price Charts, Trends & Potential Movements
Here, we analyze price action, support/resistance levels, moving averages, RSI, MACD, and other indicators to forecast near- and long-term movements.
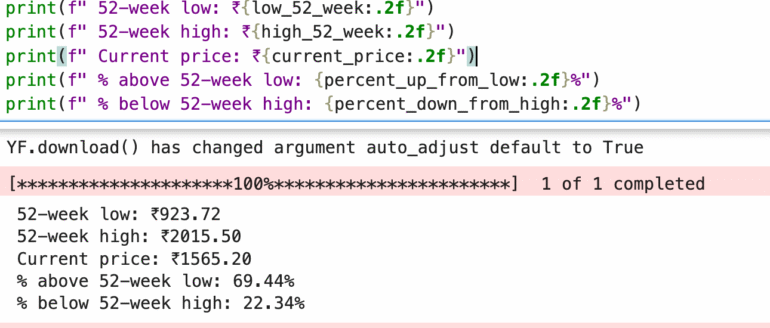
📈 BDL 52-Week Price Performance Snapshot
52-Week Low: ₹923.72
52-Week High: ₹2015.50
Current Market Price: ₹1565.20
BDL’s stock is currently 69.44% above its 52-week low, showing strong upward momentum over the past year. However, it still trades 22.34% below its 52-week high, suggesting room for recovery if broader defence sector sentiment improves.
📊 Interpretation:
This range indicates that while the stock has delivered significant gains, it is still consolidating below its recent peak. Investors may see this as a potential accumulation zone, particularly if upcoming defence orders and earnings remain strong.
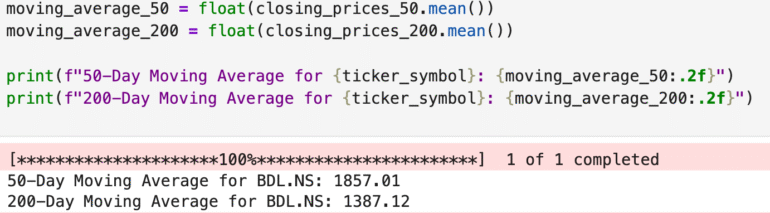
📊 BDL Moving Averages Analysis
50-Day Moving Average (MA): ₹1857.01
200-Day Moving Average (MA): ₹1387.12
Current Market Price: ₹1565.20
📉 Technical Insight:
BDL’s current share price is below its 50-day MA but above its 200-day MA.
➡️ This suggests short-term weakness or consolidation, but the long-term trend remains positive.
➡️ If the price reclaims the 50-DMA, it could signal a potential breakout or momentum recovery.
➡️ Holding above the 200-DMA is generally seen as a bullish signal for long-term investors.
📌 Conclusion:
While near-term volatility is visible, the stock’s position above the 200-day average indicates continued long-term strength. Investors may consider tracking price movement around the 50-DMA for signs of trend reversal or entry opportunities.
🔍 Competitor Analysis: How BDL Stacks Up
Bharat Dynamics Ltd. (BDL) is a key defence PSU under the Ministry of Defence, specializing in the production of strategic missiles, torpedoes, and defence systems. With growing focus on Atmanirbhar Bharat and increasing defence exports, BDL is gaining strong traction. However, evaluating it alongside sector peers provides better context:
BEL – Defence electronics PSU with govt. backing, strong margins, steady growth.
GRSE – Navy-focused shipbuilder, key player in maritime defence.
HAL – Aerospace PSU with robust orders, exports, and long-term growth.
✅ Comparing these players helps investors assess BDL’s unique role in India’s missile manufacturing ecosystem, especially its growth potential in exports, R&D, and strategic defence collaborations. While BEL offers steady compound returns and GRSE taps into naval infrastructure, BDL represents India’s missile strength with a high-tech, scalable future.