
🔄 Last Updated: Analysis Based on Data Till 20 August 2025
BEL Share Price Target
Based on recent technical trends and sector outlook, Bharat Electronics Ltd. (BEL.NS) is showing sustained strength, supported by robust order inflows and defense sector momentum. If defense modernization, exports, and Make in India initiatives continue to accelerate, the stock could aim for ₹460 in the coming months, reflecting further growth potential from current levels.
📉 Downside Risk: ₹320
📈 Upside Potential: ₹460 (approx. +22%)
🔎 Note: These targets are indicative and not guaranteed. Investors should track order execution, global supply chain conditions, defense spending, and overall market sentiment, and consult a registered financial advisor before making investment decisions.
Company Overview
Bharat Electronics Ltd. (BEL) is a leading Indian defense public sector enterprise, specializing in advanced electronic products and systems for the armed forces. With expertise in radars, communication, naval systems, and electronic warfare, BEL plays a critical role in India’s defense modernization, exports, and self-reliance initiatives.
📊 For Short-Term / Intraday Traders:
If you want daily trading levels, live analysis, and intraday strategies for BEL and other stocks — join our free Telegram group, where you get professional-level market insights and trading guidance every day.
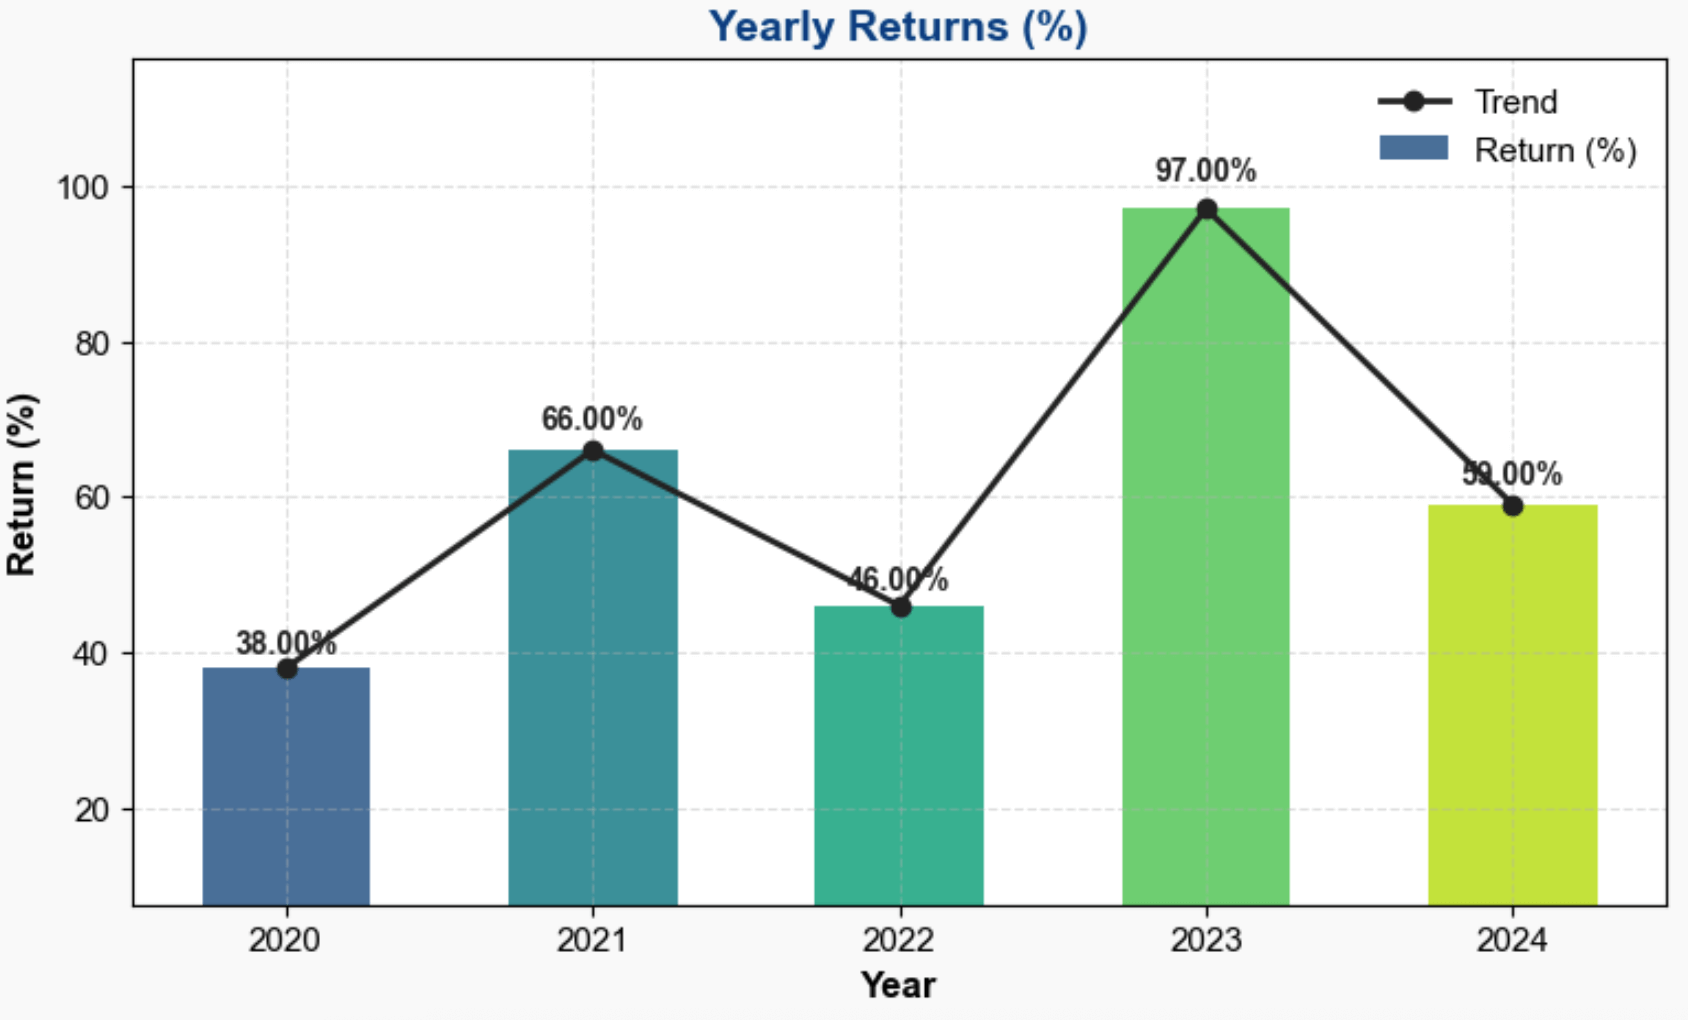
Between 2020 and 2024, BEL (Bharat Electronics Ltd.) proved to be a true multibagger for investors. In 2020, it started with a strong +37.87% return, followed by an exceptional +65.88% in 2021, driven by robust defence sector demand. The momentum continued in 2022 with a solid +45.84% gain. The real highlight was 2023, when BEL nearly doubled investors’ wealth with a massive +97.40% return. Even in 2024, the stock maintained strong growth, delivering +59.28%. Overall, BEL has consistently rewarded long-term investors with stellar returns.
हिंदी सारांश:
BEL ने 2020 में +37.87% और 2021 में +65.88% का शानदार रिटर्न दिया। 2022 में भी +45.84% की तेजी रही। 2023 में स्टॉक ने लगभग दोगुना करते हुए +97.40% का रिटर्न दिया, और 2024 में भी +59.28% की मजबूती दर्ज की। कुल मिलाकर, BEL ने लंबे समय में निवेशकों को multibagger रिटर्न दिए।
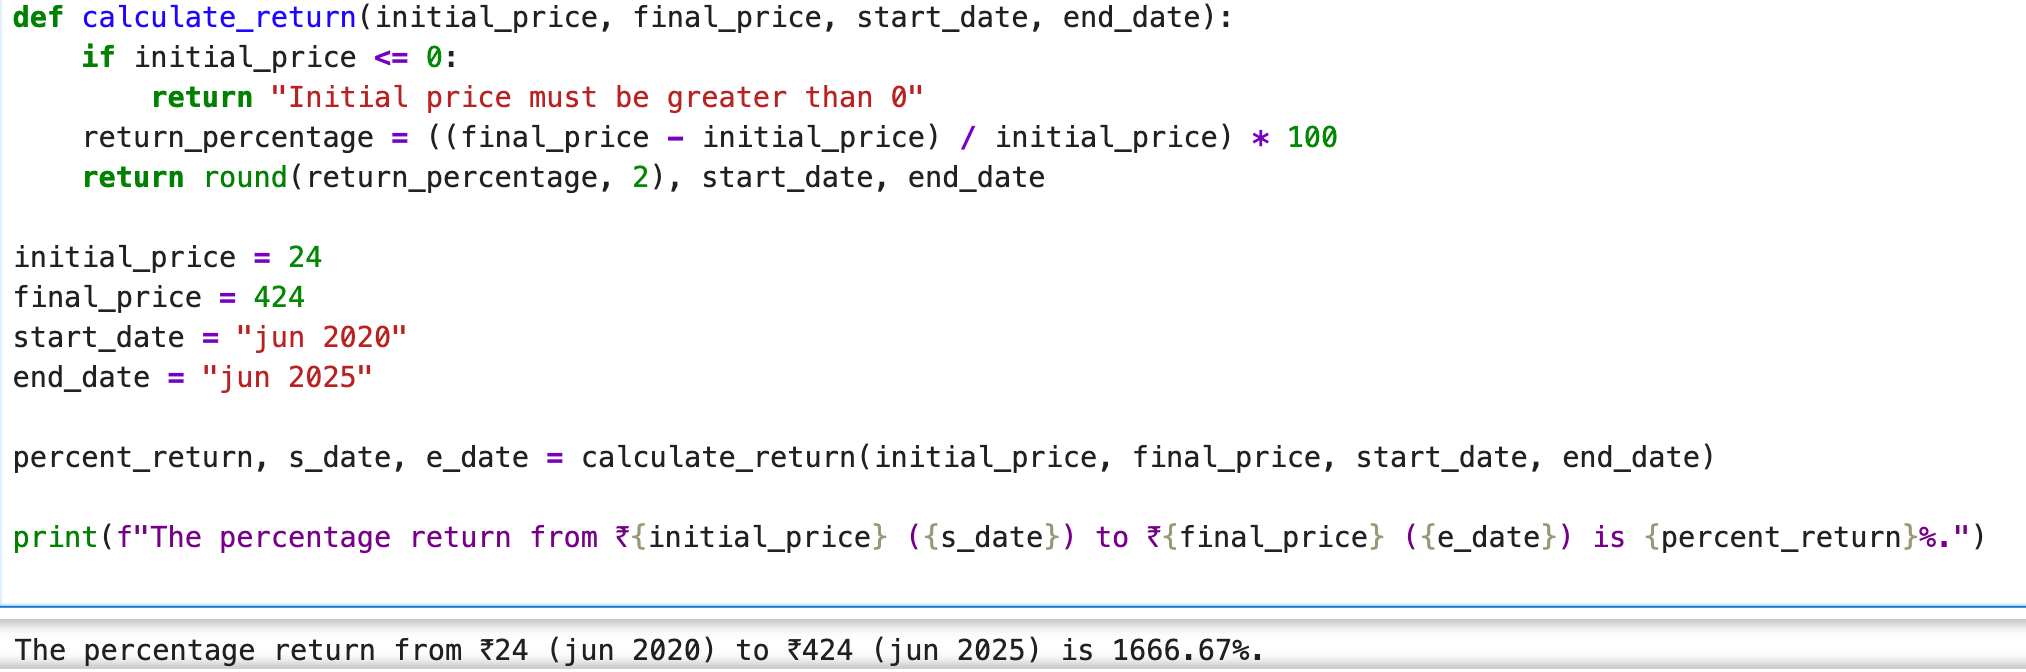
BEL Multibagger Returns (Jun 2020–Jun 2025)
If an investor had bought BEL (Bharat Electronics Ltd.) shares at ₹24 in June 2020 and held them until June 2025, when the price reached around ₹424 –
Total Return = (424 − 24) ÷ 24 × 100 = 1666.67%
That means an investment of ₹1,00,000 would have grown to nearly ₹17,66,667 in just 5 years.
👉 This shows that BEL delivered multibagger returns over this period — powered by defence sector growth, government orders, and strong financial performance.
📊 BEL Financial Overview (2021–2025)
| Particulars | Mar 25 | Mar 24 | Mar 23 | Mar 22 | Mar 21 |
|---|---|---|---|---|---|
| EQUITIES AND LIABILITIES | |||||
| Equity Share Capital | 730.98 | 730.98 | 730.98 | 243.66 | 243.66 |
| Total Share Capital | 730.98 | 730.98 | 730.98 | 243.66 | 243.66 |
| Reserves and Surplus | 19,242.91 | 15,595.49 | 13,130.65 | 12,042.27 | 10,815.92 |
| Total Reserves and Surplus | 19,242.91 | 15,595.49 | 13,130.65 | 12,042.27 | 10,815.92 |
| Minority Interest | 18.94 | 17.92 | 17.75 | 16.34 | 14.99 |
| Total Shareholders Funds | 19,973.89 | 16,326.47 | 13,861.63 | 12,285.93 | 11,059.58 |
| NON-CURRENT LIABILITIES | |||||
| Deferred Tax Liabilities [Net] | 9.52 | 5.47 | 2.89 | 1.45 | 0.36 |
| Other Long Term Liabilities | 174.81 | 182.81 | 198.47 | 220.50 | 173.16 |
| Long Term Provisions | 902.16 | 967.28 | 844.65 | 1,805.32 | 1,412.03 |
| Total Non-Current Liabilities | 1,086.49 | 1,155.56 | 1,046.01 | 2,027.27 | 1,585.55 |
| CURRENT LIABILITIES | |||||
| Trade Payables | 3,338.77 | 3,706.31 | 3,330.38 | 3,369.30 | 3,298.22 |
| Other Current Liabilities | 15,674.06 | 17,625.89 | 16,607.86 | 15,787.92 | 13,183.31 |
| Short Term Provisions | 739.71 | 694.53 | 627.54 | 423.82 | 350.28 |
| Total Current Liabilities | 19,752.54 | 22,026.73 | 20,565.78 | 19,581.04 | 16,831.81 |
| Total Capital And Liabilities | 40,831.86 | 39,526.68 | 35,491.17 | 33,910.58 | 29,491.93 |
| ASSETS | |||||
| Tangible Assets | 3,204.57 | 2,788.51 | 2,694.37 | 2,509.44 | 2,485.58 |
| Intangible Assets | 214.66 | 246.70 | 268.49 | 165.82 | 166.56 |
| Capital Work-In-Progress | 476.98 | 456.42 | 361.23 | 445.93 | 397.47 |
| Intangible Assets Under Development | 574.82 | 437.30 | 493.71 | 560.11 | 485.21 |
| Fixed Assets | 4,471.03 | 3,928.93 | 3,817.80 | 3,681.30 | 3,534.82 |
| Non-Current Investments | 742.97 | 682.23 | 649.99 | 1,572.02 | 1,305.94 |
| Deferred Tax Assets [Net] | 534.84 | 574.68 | 503.72 | 620.94 | 463.46 |
| Long Term Loans And Advances | 6.63 | 7.03 | 6.56 | 7.28 | 33.60 |
| Other Non-Current Assets | 218.51 | 270.83 | 465.36 | 735.33 | 399.16 |
| Total Non-Current Assets | 5,973.98 | 5,463.70 | 5,443.43 | 6,616.87 | 5,736.98 |
| CURRENT ASSETS | |||||
| Inventories | 9,118.98 | 7,446.89 | 6,448.04 | 5,591.90 | 5,007.36 |
| Trade Receivables | 9,116.37 | 7,392.38 | 7,033.48 | 6,108.09 | 6,561.99 |
| Cash And Cash Equivalents | 9,545.10 | 11,056.59 | 8,111.58 | 7,563.74 | 5,073.76 |
| Short Term Loans And Advances | 1.47 | 1.41 | 1.72 | 1.48 | 15.66 |
| Other Current Assets | 7,075.96 | 8,165.71 | 8,452.92 | 8,028.50 | 7,096.18 |
| Total Current Assets | 34,857.88 | 34,062.98 | 30,047.74 | 27,293.71 | 23,754.95 |
| Total Assets | 40,831.86 | 39,526.68 | 35,491.17 | 33,910.58 | 29,491.93 |
| OTHER ADDITIONAL INFORMATION | |||||
| Contingent Liabilities | 3,902.00 | 4,461.63 | 3,156.20 | 2,610.78 | 2,487.16 |
| Bonus Equity Share Capital | 171.25 | 171.25 | 171.25 | 171.25 | 171.25 |
| Non-Current Investments Unquoted Book Value | 581.61 | 530.66 | 449.26 | 1,339.10 | 1,116.05 |
| Particulars | Mar 25 | Mar 24 | Mar 23 | Mar 22 | Mar 21 |
|---|---|---|---|---|---|
| INCOME | |||||
| Revenue From Operations [Gross] | 23,117.30 | 19,905.49 | 17,404.18 | 15,084.74 | 13,849.71 |
| Revenue From Operations [Net] | 23,117.30 | 19,905.49 | 17,404.18 | 15,084.74 | 13,849.71 |
| Other Operating Revenues | 651.45 | 362.75 | 330.26 | 283.44 | 258.98 |
| Total Operating Revenues | 23,768.75 | 20,268.24 | 17,734.44 | 15,368.18 | 14,108.69 |
| Other Income | 742.36 | 670.14 | 280.80 | 231.54 | 124.96 |
| Total Revenue | 24,511.11 | 20,938.38 | 18,015.24 | 15,599.72 | 14,233.65 |
| EXPENSES | |||||
| Cost Of Materials Consumed | 12,578.18 | 10,509.18 | 9,392.99 | 8,123.95 | 6,717.52 |
| Purchase Of Stock-In Trade | 430.41 | 628.86 | 827.85 | 1,053.49 | 1,233.21 |
| Changes In Inventories Of FG,WIP And Stock-In Trade | -821.36 | -561.72 | -393.28 | -280.28 | -124.69 |
| Employee Benefit Expenses | 2,760.63 | 2,489.49 | 2,317.34 | 2,128.01 | 1,955.89 |
| Finance Costs | 9.68 | 7.14 | 14.95 | 5.05 | 6.37 |
| Depreciation And Amortisation Expenses | 467.38 | 443.20 | 428.82 | 401.13 | 387.32 |
| Other Expenses | 1,987.19 | 2,156.02 | 1,503.66 | 1,002.13 | 1,137.00 |
| Total Expenses | 17,412.11 | 15,672.17 | 14,092.33 | 12,433.48 | 11,291.87 |
| Profit/Loss Before Exceptional, ExtraOrdinary Items And Tax | 7,099.00 | 5,266.21 | 3,922.91 | 3,166.24 | 2,941.78 |
| Profit/Loss Before Tax | 7,099.00 | 5,266.21 | 3,922.91 | 3,166.24 | 2,941.78 |
| Tax Expenses-Continued Operations | |||||
| Current Tax | 1,767.75 | 1,455.76 | 877.47 | 914.31 | 826.54 |
| Deferred Tax | 41.50 | -63.73 | 125.10 | -102.59 | 70.82 |
| Tax For Earlier Years | 2.60 | -68.93 | -20.01 | 0.06 | -24.92 |
| Total Tax Expenses | 1,811.85 | 1,323.10 | 982.56 | 811.78 | 872.44 |
| Profit/Loss After Tax And Before ExtraOrdinary Items | 5,287.15 | 3,943.11 | 2,940.35 | 2,354.46 | 2,069.34 |
| Profit/Loss From Continuing Operations | 5,287.15 | 3,943.11 | 2,940.35 | 2,354.46 | 2,069.34 |
| Profit/Loss For The Period | 5,287.15 | 3,943.11 | 2,940.35 | 2,354.46 | 2,069.34 |
| Minority Interest | -1.24 | -0.72 | -1.82 | -1.35 | -0.82 |
| Share Of Profit/Loss Of Associates | 35.53 | 42.13 | 45.89 | 45.76 | 30.42 |
| Consolidated Profit/Loss After MI And Associates | 5,321.44 | 3,984.52 | 2,984.42 | 2,398.87 | 2,098.94 |
| OTHER ADDITIONAL INFORMATION | |||||
| Basic EPS (Rs.) | 7.00 | 5.00 | 4.00 | 10.00 | 9.00 |
| Diluted EPS (Rs.) | 7.00 | 5.00 | 4.00 | 10.00 | 9.00 |
| DIVIDEND AND DIVIDEND PERCENTAGE | |||||
| Equity Share Dividend | 1,681.24 | 1,461.96 | 1,242.70 | 1,023.35 | 1,023.38 |
| Particulars | Mar '25 | Mar '24 | Mar '23 | Mar '22 | Mar '21 |
|---|---|---|---|---|---|
| Investment Valuation Ratios | |||||
| Face Value | 1.00 | 1.00 | 1.00 | 1.00 | 1.00 |
| Dividend Per Share | -- | -- | -- | -- | -- |
| Operating Profit Per Share (Rs) | 9.35 | 6.90 | 5.59 | 13.71 | 13.18 |
| Net Operating Profit Per Share (Rs) | 32.52 | 27.73 | 24.26 | 63.07 | 57.90 |
| Free Reserves Per Share (Rs) | -- | -- | -- | -- | -- |
| Bonus in Equity Capital | 23.42 | 23.42 | 23.42 | 70.28 | 70.28 |
| Profitability Ratios | |||||
| Operating Profit Margin (%) | 28.75 | 24.89 | 23.03 | 21.73 | 22.75 |
| Profit Before Interest And Tax Margin (%) | 25.97 | 21.98 | 20.29 | 18.84 | 19.83 |
| Gross Profit Margin (%) | 26.78 | 22.71 | 20.62 | 19.12 | 20.01 |
| Cash Profit Margin (%) | 23.47 | 20.94 | 18.70 | 17.66 | 17.25 |
| Adjusted Cash Margin (%) | 23.47 | 20.94 | 18.70 | 17.66 | 17.25 |
| Net Profit Margin (%) | 22.38 | 19.65 | 16.82 | 15.60 | 14.87 |
| Adjusted Net Profit Margin (%) | 21.71 | 19.02 | 16.56 | 15.37 | 14.74 |
| Return On Capital Employed (%) | 35.58 | 32.29 | 28.40 | 25.81 | 26.65 |
| Return On Net Worth (%) | 26.64 | 24.40 | 21.53 | 19.52 | 18.97 |
| Adjusted Return on Net Worth (%) | 26.47 | 24.15 | 21.21 | 19.16 | 18.71 |
| Return on Assets Excluding Revaluations | 27.35 | 22.36 | 18.99 | 50.49 | 45.45 |
| Return on Assets Including Revaluations | 27.35 | 22.36 | 18.99 | 50.49 | 45.45 |
| Return on Long Term Funds (%) | 35.58 | 32.29 | 28.40 | 25.81 | 26.65 |
| Liquidity And Solvency Ratios | |||||
| Current Ratio | 1.71 | 1.51 | 1.44 | 1.33 | 1.34 |
| Quick Ratio | 1.25 | 1.16 | 1.11 | 1.04 | 1.04 |
| Debt Equity Ratio | -- | -- | -- | -- | -- |
| Long Term Debt Equity Ratio | -- | -- | -- | -- | -- |
| Debt Coverage Ratios | |||||
| Interest Cover | 734.37 | 738.56 | 263.40 | 627.98 | 462.82 |
| Total Debt to Owners Fund | -- | -- | -- | -- | -- |
| Financial Charges Coverage Ratio | 782.65 | 800.64 | 292.09 | 707.41 | 523.62 |
| Financial Charges Coverage Ratio Post Tax | 599.02 | 621.13 | 229.31 | 555.46 | 391.31 |
| Management Efficiency Ratios | |||||
| Inventory Turnover Ratio | 2.61 | 2.72 | 2.75 | 2.75 | 2.84 |
| Debtors Turnover Ratio | 2.88 | 2.81 | 2.70 | 2.43 | 2.12 |
| Investments Turnover Ratio | 1.19 | 1.24 | 1.28 | 1.25 | 1.28 |
| Fixed Assets Turnover Ratio | 3.70 | 3.62 | 3.46 | 3.38 | 3.99 |
| Total Assets Turnover Ratio | 1.20 | 1.26 | 1.30 | 1.27 | 1.27 |
| Asset Turnover Ratio | 1.31 | 1.34 | 1.35 | 1.31 | 1.33 |
| Average Raw Material Holding | -- | -- | -- | -- | -- |
| Average Finished Goods Held | -- | -- | -- | -- | -- |
| Number of Days In Working Capital | 106.84 | 49.09 | -0.15 | -55.41 | -44.60 |
| Profit & Loss Account Ratios | |||||
| Material Cost Composition | 54.72 | 54.95 | 57.63 | 59.71 | 56.35 |
| Imported Composition of Raw Materials Consumed | -- | -- | -- | -- | -- |
| Selling Distribution Cost Composition | 0.06 | 0.06 | 0.09 | 0.01 | 0.02 |
| Expenses as Composition of Total Sales | -- | -- | -- | -- | -- |
| Cash Flow Indicator Ratios | |||||
| Dividend Payout Ratio Net Profit | 31.59 | 36.69 | 41.63 | 42.65 | 48.75 |
| Dividend Payout Ratio Cash Profit | 29.04 | 33.01 | 36.40 | 36.54 | 41.16 |
| Earning Retention Ratio | 68.21 | 62.93 | 57.74 | 56.54 | 50.55 |
| Cash Earning Retention Ratio | 70.79 | 66.67 | 63.12 | 62.87 | 58.35 |
| Adjusted Cash Flow Times | -- | -- | -- | -- | -- |
| Particulars | Mar '25 (12 mths) | Mar '24 (12 mths) | Mar '23 (12 mths) | Mar '22 (12 mths) | Mar '21 (12 mths) |
|---|---|---|---|---|---|
| Net Profit Before Tax | 7,134.53 | 5,308.34 | 3,968.80 | 3,212.00 | 2,972.20 |
| Net Cash From Operating Activities | 586.62 | 4,659.49 | 1,266.86 | 4,207.22 | 5,093.22 |
| Net Cash (used in)/from Investing Activities | 616.94 | -5,923.85 | 2,690.84 | -4,871.66 | -2,595.22 |
| Net Cash (used in)/from Financing Activities | -1,696.43 | -1,475.01 | -1,312.87 | -1,077.60 | -1,075.73 |
| Net (decrease)/increase In Cash and Cash Equivalents | -492.87 | -2,739.37 | 2,644.83 | -1,742.04 | 1,422.27 |
| Opening Cash & Cash Equivalents | 1,206.32 | 3,945.69 | 1,300.86 | 3,042.90 | 1,620.63 |
| Closing Cash & Cash Equivalents | 713.45 | 1,206.32 | 3,945.69 | 1,300.86 | 3,042.90 |
✨ Bharat Electronics Ltd. (BEL) 📊 Fundamental Analysis
Consistent Growth with Strong Financial Discipline
Bharat Electronics (BEL) is a leading defense electronics company in India, showing consistent revenue growth, strong margins, and effective capital management. The company’s zero-debt structure and rising ROE highlight its financial strength.
🔸 Revenue & Growth (CAGR: 14.55%)
| Year | Revenue (₹ Cr) | Growth (%) |
|---|---|---|
| 2021 | 14,233.65 | — |
| 2022 | 15,599.72 | +9.60% |
| 2023 | 18,015.24 | +15.48% |
| 2024 | 20,938.38 | +16.23% |
| 2025 | 24,511.11 | +17.06% |
📈 BEL has delivered steady double-digit revenue growth, reflecting robust demand in defense and electronics sectors.
🔸 Net Profit & Margins
| Year | Net Profit (₹ Cr) | Net Profit Margin (%) |
|---|---|---|
| 2021 | 2,098.94 | 14.75 |
| 2022 | 2,398.87 | 15.38 |
| 2023 | 2,984.42 | 16.57 |
| 2024 | 3,984.52 | 19.03 |
| 2025 | 5,321.44 | 21.71 |
💡 Profitability is improving steadily, with margins expanding year after year.
🔸 EPS (Earnings Per Share) Growth
| Year | EPS (₹) | EPS Growth (%) |
|---|---|---|
| 2021 | 9.0 | — |
| 2022 | 10.0 | +11.11 |
| 2023 | 4.0 | -60.00 |
| 2024 | 5.0 | +25.00 |
| 2025 | 7.0 | +40.00 |
📊 EPS growth was volatile in 2023 but recovered strongly in subsequent years.
🔸 Return on Equity (ROE)
| Year | Net Profit (₹ Cr) | Average Equity (₹ Cr) | ROE (%) |
|---|---|---|---|
| 2021 | 2,098.94 | — | — |
| 2022 | 2,398.87 | 11,672.76 | 20.55 |
| 2023 | 2,984.42 | 13,073.78 | 22.83 |
| 2024 | 3,984.52 | 15,094.05 | 26.40 |
| 2025 | 5,321.44 | 18,150.18 | 29.32 |
📈 ROE has shown consistent improvement, crossing 29% in FY25, highlighting efficient capital utilization.
🔸 Debt Metrics
| Year | Total Borrowings (₹ Cr) | Shareholders’ Funds (₹ Cr) | Debt-to-Equity |
|---|---|---|---|
| Mar 21 | 0 | 11,059.58 | 0.00 |
| Mar 22 | 0 | 12,285.93 | 0.00 |
| Mar 23 | 0 | 13,861.63 | 0.00 |
| Mar 24 | 0 | 16,326.47 | 0.00 |
| Mar 25 | 0 | 19,973.89 | 0.00 |
💳 BEL maintains a zero-debt structure, ensuring financial safety and stability.
🔸 Liabilities-to-Equity Ratio
| Year | Total Liabilities (₹ Cr) | Shareholders’ Funds (₹ Cr) | Ratio |
|---|---|---|---|
| Mar 21 | 18,417.36 | 11,059.58 | 1.67 |
| Mar 22 | 21,608.31 | 12,285.93 | 1.76 |
| Mar 23 | 21,611.79 | 13,861.63 | 1.56 |
| Mar 24 | 23,182.29 | 16,326.47 | 1.42 |
| Mar 25 | 20,839.03 | 19,973.89 | 1.04 |
⚖️ The liabilities ratio has improved significantly, moving closer to 1.0, indicating strong equity support.
✅ Summary: Is BEL a Good Long-Term Investment?
- Strengths:
🚀 Steady revenue and profit growth
📈 Rising ROE and expanding margins
💰 Zero debt ensures strong financial stability
🏅 Improved liabilities-to-equity ratio - Risks:
⚠️ EPS volatility in FY23
⚠️ High working capital cycles due to defense sector nature
🧠 Final Verdict:
Bharat Electronics Ltd. is a financially strong PSU with consistent growth, zero-debt balance sheet, and rising profitability. It remains a solid long-term investment choice for investors seeking stability and compounding returns.
BEL Shareholding Pattern (Jun 2025)
| Category | Percentage | % Change QoQ |
|---|---|---|
| Promoters | 51.14% | 0.00 |
| Pledge | 0.00% | 0.00 |
| FII | 18.56% | +1.01 |
| DII | 20.59% | -0.18 |
| Mutual Funds | 14.60% | -0.42 |
| Others | 9.70% | -0.84 |
BEL Shareholding Pattern (June 2025)
As of June 2025, promoters hold a steady 51.14% stake, unchanged QoQ, with zero pledged shares—signalling continued confidence. FII ownership rose to 18.56% (from 17.55%), indicating growing foreign interest. DII holdings eased slightly to 20.59% (from 20.77%), while Mutual Funds trimmed stakes to 14.60% (from 15.02%). The Others category declined to 9.70% (from 10.54%), suggesting rotation toward institutional hands. Versus Sep–Dec 2024, promoters stayed constant; FIIs trended up (17.27% → 18.56%), DIIs were broadly stable, and mutual funds moderated from prior highs. Overall, BEL’s shareholding shows stable promoter control and rising foreign participation.
📈BEL Technical Analysis: Price Charts, Trends & Potential Movements
Here, we analyze price action, support/resistance levels, moving averages, RSI, MACD, and other indicators to forecast near- and long-term movements.
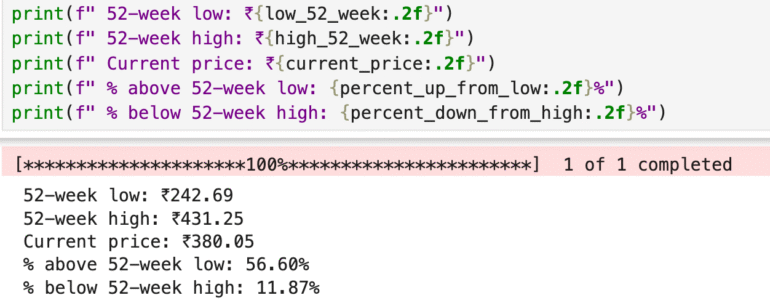
Bharat Electronics Ltd. (BEL.NS) 📊 52-Week Price Performance Snapshot
52-week low: ₹242.69
52-week high: ₹431.25
Current price: ₹380.05
BEL is currently trading 56.60% above its 52-week low, highlighting strong recovery and investor confidence from its earlier trough. However, the stock is still 11.87% below its 52-week high, suggesting scope for further upside if momentum continues. This positions BEL as a relatively strong performer in the defense sector, with resilience supported by robust order inflows, defense modernization, and government-backed initiatives. Investors may see the stock as a balance between stability and growth, but should closely track defense spending trends, export opportunities, and overall market sentiment before taking fresh positions.
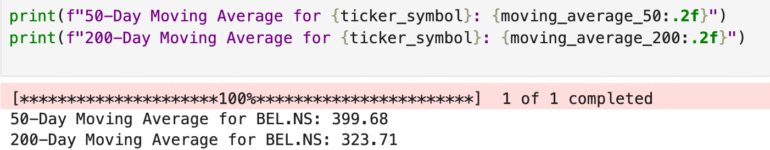
Bharat Electronics Ltd. (BEL.NS) 📊 Moving Averages Snapshot
50-Day Moving Average: ₹399.68
200-Day Moving Average: ₹323.71
BEL is currently trading comfortably above both its 50-day and 200-day moving averages, indicating strong bullish momentum in both the short and long term. The stock’s sustained strength above these levels reflects investor confidence, driven by defense sector tailwinds and consistent order inflows. For traders, the 50-day average may act as a key support, while long-term investors could view the current trend as a continuation of BEL’s broader uptrend, provided earnings growth and defense modernization initiatives remain supportive.
🔍 Competitor Analysis: How BEL Stacks Up
Bharat Electronics Ltd. (BEL) is India’s premier defence electronics company, delivering advanced communication, radar, and surveillance systems to the Indian Armed Forces. Known for its strong government order pipeline, consistent dividend history, and long-term growth in indigenous defence tech, BEL remains a benchmark in the defence PSU space. Here’s how it compares to its key peers:
BDL Share Price Target 2025–2026 – Bharat Dynamics Ltd. is India’s leading missile manufacturer, supplying strategic weapon systems to the defence forces. With increasing export opportunities and indigenous R&D, BDL is a high-tech, growth-focused player.
GRSE Share Price Target 2025–2026 – Garden Reach Shipbuilders & Engineers Ltd. specializes in building naval warships, frigates, and survey vessels. As India focuses on maritime security, GRSE stands to benefit from rising defence capex.
✅ These comparisons help investors understand BEL’s leadership in defence electronics, its financial stability, and its low-risk profile relative to the more cyclical or niche peers like BDL and GRSE. For long-term investors seeking consistent returns and exposure to India’s self-reliance in defence, BEL offers a strong mix of growth and reliability.