
👋 Bhupendra Rawat
Stock Market Data Analyst | Programming Enthusiast | 4+ Years of Experience
Empowering insights with data & code🔍 Expertise:
- Fundamental & Technical Analysis
- Python & Pandas for Stock Data
- Interactive Financial Dashboards
- JavaScript & Chart.js Visualization
🔄 Last Updated: Analysis Based on Data Till 2 August 2025
🚢 GRSE Share Price Target 2025–2026: Riding the Wave of Defence & Maritime Expansion?
Garden Reach Shipbuilders & Engineers (GRSE), a premier defence PSU under the Ministry of Defence, specializes in building warships and vessels for the Indian Navy and Coast Guard, playing a vital role in India’s maritime security.
The share price outlook for GRSE by 2025–26 is expected to be shaped by:
Rising defence allocations and naval modernization programs
Strong execution of shipbuilding orders for domestic and export markets
Expansion into modular platforms and marine engineering
Healthy order book and consistent revenue growth
Government’s push for “Atmanirbhar Bharat” in defence manufacturing
With a robust pipeline of naval contracts and export potential, GRSE is poised for sustainable long-term growth. However, execution timelines, global supply chain dynamics, and defence policy decisions will remain key variables.
Amid geopolitical tensions and India’s focus on naval strength, GRSE could emerge as a reliable long-term player in the strategic defence sector.
✅ 2026 Target View – GRSE:
If defence order delays, supply chain disruptions, or rising input costs impact margins, G.R.S.E’s stock may decline to ₹2,200.
However, if naval contracts, export orders, and defence spending continue progressing well, the stock could rise to ₹3,200.
📉 Downside Risk: ₹2,200 (approx. -15%)
📈 Upside Potential: ₹3,200(approx. +24%)
🔎 Note:
Stock price targets are indicative, not guaranteed.
Analysts consider company fundamentals, order backlog, technical trends, and broader market sentiment while making such projections.
📊 For Short-Term / Intraday Traders:
If you want daily trading levels, live analysis, and intraday strategies for GRSE and other stocks —
join our free Telegram group, where you get professional-level market insights and trading guidance every day.
📊 GRSE Financial Overview (2021–2025)
📊 G.R.S.E Fundamental Analysis: Evaluating the Core Strength of the Company
This section dives into revenue growth, net profit, EPS, ROE, debt-to-equity, and other key financial metrics to understand long-term stability.
🔸 Revenue & Growth
The company has exhibited strong and consistent revenue growth over the past five years, more than quadrupling its revenue from ₹1,140.84 Cr in 2021 to ₹5,075.69 Cr in 2025. Growth has remained above 40% since 2022, indicating robust operational execution.
➡️ 2021: ₹1,140.84 Cr
➡️ 2022: ₹1,757.51 Cr (+54.05%)
➡️ 2023: ₹2,561.15 Cr (+45.73%)
➡️ 2024: ₹3,592.64 Cr (+40.27%)
➡️ 2025: ₹5,075.69 Cr (+41.28%)
📈 The company’s revenue growth has consistently stayed in the 40–55% range, highlighting exceptional project execution and scaling capability.
🔸 Net Profit & Margins
Net profit has also grown significantly, more than tripling from 2021 to 2025. However, net profit margins saw a dip in mid-years and are now recovering steadily.
➡️ 2021: ₹153.47 Cr (Margin: 13.45%)
➡️ 2022: ₹189.53 Cr (10.78%)
➡️ 2023: ₹228.12 Cr (8.91%)
➡️ 2024: ₹357.27 Cr (9.94%)
➡️ 2025: ₹527.40 Cr (10.39%)
💡 While margins dipped slightly between 2022 and 2023, they have started improving again, reflecting better cost controls and operational efficiency.
🔸 EPS & Growth
Earnings Per Share (EPS) has shown significant improvement — especially from 2023 onwards — signaling solid bottom-line growth.
➡️ 2021: ₹13.40
➡️ 2022: ₹16.55 (+23.51%)
➡️ 2023: ₹19.91 (+20.30%)
➡️ 2024: ₹31.19 (+56.65%)
➡️ 2025: ₹46.04 (+47.61%)
📊 Strong EPS growth in 2024 and 2025 reflects powerful profit expansion and shareholder value creation.
🔸 Return on Equity (ROE)
ROE has steadily improved, jumping from 15.83% in FY22 to 28.11% in FY25 — signaling efficient capital utilization and improving profitability.
➡️ FY22: 15.83%
➡️ FY23: 17.08%
➡️ FY24: 23.14%
➡️ FY25: 28.11%
📈 Rising ROE points to increased investor confidence and management’s effective deployment of equity capital.
🔸 Debt-to-Equity Ratio
The debt-to-equity ratio has significantly improved from a high of 6.62 in FY23 to 3.98 in FY25, showing better financial discipline and reduced leverage.
➡️ FY21: 4.97
➡️ FY22: 5.07
➡️ FY23: 6.62
➡️ FY24: 5.13
➡️ FY25: 3.98
📉 The reduction in debt-to-equity over the past two years reflects stronger balance sheet health and risk mitigation.
📌 Conclusion
G.R.S.E is on a robust growth trajectory, backed by expanding revenue, accelerating profits, strong EPS growth, and improved capital efficiency. Its improving ROE and declining debt-to-equity ratio are clear signs of financial strength and long-term sustainability.
✅ Why it stands out:
Consistent double-digit revenue growth
Strong EPS and net profit growth
Rising ROE reflecting superior returns
Lowering debt-to-equity signals improved financial health
🚀 If this momentum continues, G.R.S.E is well-positioned to deliver sustained value in the coming years.
📈NBCC Technical Analysis: Price Charts, Trends & Potential Movements
Here, we analyze price action, support/resistance levels, moving averages, RSI, MACD, and other indicators to forecast near- and long-term movements.
📈 GRSE Share Performance Snapshot (2025)
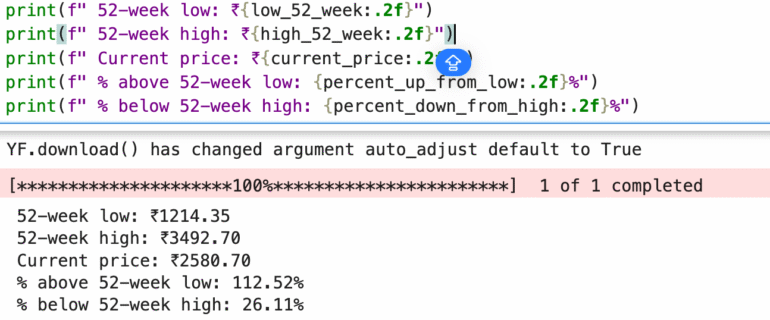
🔻 52-week Low: ₹1,214.35
🔺 52-week High: ₹3,492.70
📊 Current Price: ₹2,580.70
➡️ Above 52-week Low by: +112.52%
⬅️ Below 52-week High by: -26.11%
📌 This data indicates that G.R.S.E has more than doubled from its 52-week low, reflecting strong investor interest and upward momentum. Despite being around 26% off its recent high, the significant recovery signals bullish sentiment. If financial performance and order book visibility remain strong, the stock may continue its upward trajectory.
📉 GRSE Technical Overview (2025)
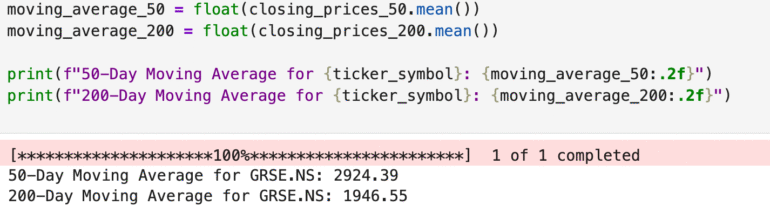
📊 Current Price: ₹2,580.70
📈 50-Day Moving Average (DMA): ₹2,924.39
📉 200-Day Moving Average (DMA): ₹1,946.55
🔍 Analysis:
The current price is below the 50-DMA (₹2,924.39), indicating short-term weakness or a phase of consolidation.
However, the stock is well above the 200-DMA (₹1,946.55), reflecting a strong bullish long-term trend.
📌 Conclusion:
While G.R.S.E may be under short-term selling pressure, its position above the 200-day moving average suggests continued investor confidence in the company’s long-term prospects. A decisive move above the 50-DMA could indicate a potential resumption of the uptrend.
🔍 Competitor Analysis: How GRSE Stacks Up
Garden Reach Shipbuilders & Engineers Ltd. (GRSE) is a leading defence PSU specializing in the construction of advanced naval vessels, frigates, corvettes, and patrol boats for the Indian Navy and Coast Guard. With India’s growing focus on maritime defence, GRSE plays a strategic role in indigenous warship production. Let’s see how it compares with other defence leaders:
BEL Share Price Target 2025–2026 – Bharat Electronics Ltd. leads in defence electronics, radar systems, and communication technologies. Known for its robust margins, high return ratios, and consistent dividend history, BEL offers long-term stability.
BDL Share Price Target 2025–2026 – Bharat Dynamics Ltd. is India’s top missile manufacturer, delivering precision-guided weapon systems. It has a strong export outlook and benefits from government push for indigenization and strategic defence manufacturing.
✅ Comparing these PSUs reveals GRSE’s niche in naval shipbuilding, setting it apart from electronics-heavy BEL and missile-centric BDL. With a rising order book, focus on exports, and Make in India tailwinds, GRSE is emerging as a critical player in India’s maritime defence ecosystem—suitable for investors seeking exposure to capital-intensive, high-growth defence manufacturing.