
👋 Bhupendra Rawat
Stock Market Data Analyst | Programming Enthusiast | 4+ Years of Experience
Empowering insights with data & code🔍 Expertise:
- Fundamental & Technical Analysis
- Python & Pandas for Stock Data
- Interactive Financial Dashboards
- JavaScript & Chart.js Visualization
L&T Share Price Target 2025–2026: Is It a Strong Bet for the Long Term?
Larsen & Toubro (L&T) is one of India’s largest and most diversified engineering and infrastructure conglomerates, with a strong presence in construction, defence, energy, and technology. As India accelerates its focus on mega infrastructure projects, railway expansion, smart cities, and green energy, L&T’s growth potential is gaining strong momentum.
The share price prediction for L&T by 2025–26 depends on several critical factors, including:
The company’s order book size and the pace of project execution
Increased government capital expenditure (Capex) across sectors
Fresh orders in defence, metro rail, and heavy engineering
L&T’s financial performance – including revenue, profit growth, and EBITDA margins
Technical chart patterns and analyst ratings from major brokerages
✅ 2026 Target View:
L&T’s stock may touch ₹3300 by 2026 if there is a market correction or slowdown in capital expenditure. However, if the company’s order book remains strong and infrastructure growth continues, it could also climb above ₹4000.
📉 Downside Risk: ₹3300 (≈ -8.3%)
📈 Upside Potential: ₹4000+
Note: Predicting the market with precision is difficult. That’s why analysts consider a combination of fundamentals, technicals, and sector trends to form a balanced view.
l&t share price target 2025-2026
📊 L&T Financial Overview (2021–2025)
📊 Fundamental Analysis: Evaluating the Core Strength of the Company
This section dives into revenue growth, net profit, EPS, ROE, debt-to-equity, and other key financial metrics to understand long-term stability.
🔸 Revenue & Growth
L&T’s total revenue has grown from ₹1.35 lakh crore in 2021 to ₹2.55 lakh crore in 2025 — reflecting a consistent annual growth rate of over 15%.
➡️ 2021: ₹1,35,979 Cr
➡️ 2022: ₹1,56,521 Cr (+15.11%)
➡️ 2023: ₹1,83,340 Cr (+17.13%)
➡️ 2024: ₹2,21,112 Cr (+20.60%)
➡️ 2025: ₹2,55,734 Cr (+15.66%)
📈 The company’s growth is stable and strong, supported by its robust order book and execution of large-scale projects.
🔸 Net Profit & Margins
L&T’s net profit has also grown steadily. While margins have remained stable (around 6.5%–7%), the growth in absolute profit reflects efficient cost management.
➡️ 2021: ₹12,906 Cr (Margin: 9.49%)
➡️ 2022: ₹10,291 Cr (6.57%)
➡️ 2023: ₹12,624 Cr (6.89%)
➡️ 2024: ₹15,569 Cr (7.04%)
➡️ 2025: ₹17,687 Cr (6.92%)
🔸 EPS & Growth
Earnings Per Share (EPS) is a critical metric for investors. L&T has shown a strong recovery in EPS post-2022:
➡️ 2021: ₹82
➡️ 2022: ₹62 (decline: -24.39%)
➡️ 2023: ₹75 (+20.97%)
➡️ 2024: ₹94 (+25.33%)
➡️ 2025: ₹109 (+15.96%)
📊 This indicates that the company continues to increase shareholder value year after year.
🔸 ROE (Return on Equity)
L&T’s return on equity is also improving, reflecting better capital utilization:
➡️ 2022: 12.89%
➡️ 2023: 131.0% (Possibly due to one-time gains or exceptional income)
➡️ 2024: 17.72%
➡️ 2025: 19.22%
🔸 Debt-to-Equity Ratio
L&T’s Debt-to-Equity Ratio has remained in the range of 2.7–2.9, which is fairly balanced for a capital-intensive infrastructure company.
➡️ 2021: 2.89
➡️ 2022: 2.72
➡️ 2023: 2.54
➡️ 2024: 2.75
➡️ 2025: 2.70
This indicates a reasonable use of leverage to fund growth and expansion.
📌 Conclusion:
L&T’s fundamental outlook is solid. Whether it’s revenue growth, rising EPS, or increasing ROE — the company has demonstrated consistent and stable performance.
If you’re considering long-term investment until 2025–2026, L&T can be seen as a strong candidate — especially in light of India’s infrastructure boom and large-scale capital expenditure plans.
📈 Technical Analysis: Price Charts, Trends & Potential Movements
Here, we analyze price action, support/resistance levels, moving averages, RSI, MACD, and other indicators to forecast near- and long-term movements.
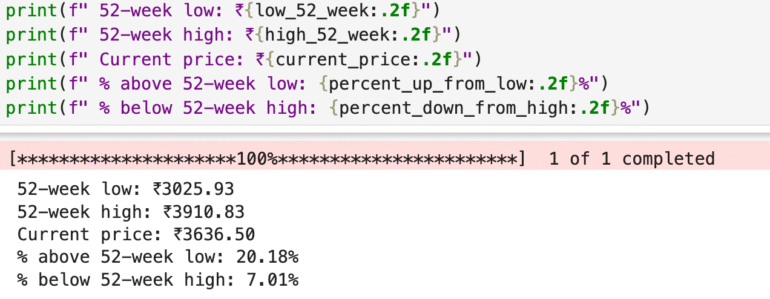
📊 L&T Share 52-Week Summary (2025)
🔻 Low: ₹3025.93
🔺 High: ₹3910.83
💹 Current Price: ₹3636.50
📈 20.18% above 52-week low
📉 7.01% below 52-week high
Insight: L&T is trading near its high, showing strong momentum and investor confidence. Good sign for long-term investors tracking growth.
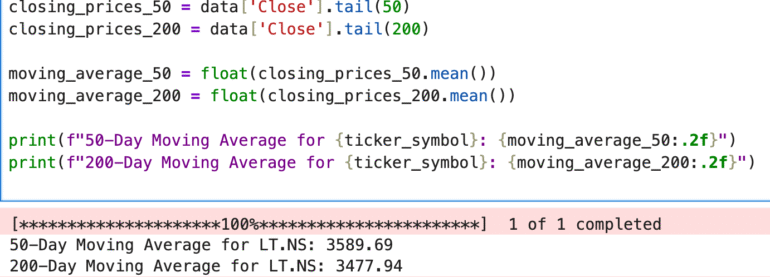
📊 Moving Averages Overview – LT.NS
🔹 50-Day Moving Average: ₹3589.69
🔹 200-Day Moving Average: ₹3477.94
🔹 Current Price: ₹3636.50
L&T’s current price is trading above both its 50-day and 200-day moving averages, indicating a bullish trend in both the short and long term. This suggests continued investor confidence and potential upward momentum.
🔍 Competitor Analysis: How L&T Stacks Up
While Larsen & Toubro (L&T) is a dominant force in India’s engineering, infrastructure, and capital goods space—with strong earnings growth, a robust order book, and steady dividend payouts—it’s valuable to compare it with other key infrastructure and EPC (engineering, procurement, and construction) players:
RVNL Share Price Target 2025–2026 – A rapidly growing government-backed railway infrastructure company focused on project execution speed and capital efficiency. Offers high growth with lower volatility due to government contracts.
- NBCC Share Price Target 2025–2026 – A PSU known for its strong real estate and government redevelopment projects. Consistent performance with predictable government-led contracts.
✅ Comparing these companies helps investors assess L&T’s leadership in execution scale, order book strength, global diversification, and superior capital allocation, while understanding how it stacks up against other infrastructure-focused firms in terms of growth, risk, and long-term stability.
📊 Analysis by Other Sector-Listed Companies
Explore share price targets and analysis of key companies from other high-growth sectors: