
👋 Bhupendra Rawat
Stock Market Data Analyst | Programming Enthusiast | 4+ Years of Experience
Empowering insights with data & code🔍 Expertise:
- Fundamental & Technical Analysis
- Python & Pandas for Stock Data
- Interactive Financial Dashboards
- JavaScript & Chart.js Visualization
🔄 Last Updated: Analysis Based on Data Till 3 August 2025
🏎️ Maruti Suzuki Share Price Target 2025–2026: India’s Auto Giant Driving Steady Growth
Maruti Suzuki, India’s largest car manufacturer, continues to maintain its leadership through strong product innovation, wide dealership reach, and cost-efficient manufacturing.
The share price outlook for 2025–26 hinges on:
📈 Strong domestic demand and rising SUV market share
🔋 Expansion into EV and hybrid segments for future readiness
🏭 Capacity additions and localisation for cost competitiveness
📊 Improving profit margins and stable return ratios
🛠️ Supply chain stability post-pandemic and semiconductor easing
With consistent revenue growth (CAGR ~21.4%) and improving ROE, Maruti is poised to benefit from India’s growing middle class and preference for personal mobility. The company’s brand equity and extensive rural network enhance its resilience in competitive times.
However, raw material inflation, regulatory costs, and EV disruption remain key risks. Still, for long-term investors, Maruti Suzuki presents a solid auto play aligned with India’s evolving mobility needs.
✅ 2026 Target View – Maruti Suzuki (MARUTI.NS)
Maruti Suzuki’s share price could face pressure if demand softens, raw material costs rise, or electric vehicle (EV) disruption accelerates without timely adaptation. In that case, the stock may test levels near ₹11,000–₹11,500.
However, if SUV volumes grow, margin expansion continues, and the EV roadmap gains traction, the stock could rally toward ₹14,000+, driven by robust fundamentals and strong market leadership.
📉 Downside Risk: ₹11,500 (approx. –6.5%)
📈 Upside Potential: ₹14,000+ (approx. +13.8%)
📌 Note: These levels are indicative and based on present market trends, macroeconomic cues, and company performance. Monitor quarterly earnings, EV adoption, and cost trends for updated guidance.
📊 For Short-Term / Intraday Traders:
If you want daily trading levels, live analysis, and intraday strategies for Maruti Suzuki and other stocks —
join our free Telegram group, where you get professional-level market insights and trading guidance every day.
📊 Maruti Suzuki Financial Overview (2021–2025)
📊 Maruti Suzuki India Fundamental Analysis: Evaluating the Core Strength of the Company
This section reviews Maruti Suzuki’s key financial indicators over the last 5 years — including revenue, profitability, EPS, return ratios, and balance sheet strength — to assess its long-term business fundamentals.
🔸 Revenue & Growth
Maruti Suzuki has delivered steady top-line growth from FY21 to FY25, with a CAGR of 21.41%. Growth peaked in FY23, reflecting post-COVID recovery and strong demand.
| Year | Revenue (₹ Cr) | Revenue Growth (%) |
|---|---|---|
| 2021 | 70,372.0 | – |
| 2022 | 88,329.8 | 25.52 |
| 2023 | 1,17,571.3 | 33.10 |
| 2024 | 1,41,858.2 | 20.66 |
| 2025 | 1,52,913.0 | 7.79 |
📈 Takeaway: Revenue growth remains healthy, supported by rising vehicle sales and improved semiconductor availability.
🔸 Net Profit & Margins
Profitability has improved significantly over the years, with margins expanding due to cost optimization and volume leverage.
| Year | Net Profit (₹ Cr) | Net Profit Margin (%) |
|---|---|---|
| 2021 | 4,220.1 | 6.00 |
| 2022 | 3,717.6 | 4.21 |
| 2023 | 8,033.6 | 6.83 |
| 2024 | 13,234.1 | 9.33 |
| 2025 | 14,256.3 | 9.32 |
💡 Insight: Profit margins rebounded strongly post-pandemic, showing operational efficiency and pricing power.
🔸 EPS & Growth
Earnings per share (EPS) has grown consistently, especially from FY23 onwards, driven by sharp profit growth.
| Year | EPS (₹) | EPS Growth (%) |
|---|---|---|
| 2021 | 145.0 | – |
| 2022 | 128.0 | -11.72 |
| 2023 | 272.0 | 112.50 |
| 2024 | 429.0 | 57.72 |
| 2025 | 461.0 | 7.46 |
📊 Note: EPS growth has normalized in FY25 after a high-growth phase — a sign of maturing profitability.
🔸 Return on Equity (ROE)
ROE has shown an upward trajectory, indicating strong returns on shareholder capital.
| Year | Net Profit (₹ Cr) | Equity (₹ Cr) | Average Equity (₹ Cr) | ROE (%) |
|---|---|---|---|---|
| 2021 | 4,220.1 | 52,500.6 | – | – |
| 2022 | 3,717.6 | 55,333.5 | 53,917.05 | 6.90 |
| 2023 | 8,033.6 | 61,791.3 | 58,562.40 | 13.72 |
| 2024 | 13,234.1 | 85,636.0 | 73,713.65 | 17.95 |
| 2025 | 14,256.3 | 96,239.9 | 90,937.95 | 15.68 |
📈 Observation: ROE peaked in FY24 and remains strong — reflecting value creation for investors.
🔸 Debt-to-Equity Ratio
Maruti Suzuki maintains a conservative capital structure with low debt-to-equity — a sign of strong financial discipline.
| Year | Total Debt (₹ Cr) | Equity (₹ Cr) | Debt-to-Equity |
|---|---|---|---|
| 2021 | 18,782.1 | 52,500.6 | 0.36 |
| 2022 | 19,322.0 | 55,333.5 | 0.35 |
| 2023 | 22,805.6 | 61,791.3 | 0.37 |
| 2024 | 29,714.8 | 85,636.0 | 0.35 |
| 2025 | 35,731.9 | 96,239.9 | 0.37 |
⚖️ Analysis: Debt levels are modest and stable, allowing room for future growth investments without strain.
🔸 Cash Flow Overview
Despite strong profits, cash generation fluctuates due to high capital expenditure and investment outflows.
| Year | Operating CF (₹ Cr) | Investing CF (₹ Cr) | Financing CF (₹ Cr) | Closing Cash (₹ Cr) |
|---|---|---|---|---|
| 2021 | 8,856.2 | -7,291.3 | -1,544.9 | 40.8 |
| 2022 | 1,840.5 | -239.2 | -1,607.0 | 35.1 |
| 2023 | 9,251.4 | -8,036.1 | -1,213.1 | 37.3 |
| 2024 | 16,801.1 | -11,864.8 | -4,062.0 | 2,659.5 |
| 2025 | 16,136.2 | -14,456.1 | -4,155.1 | 184.5 |
💬 Insight: Capex-heavy strategy limits cash accumulation, but consistent operating inflows support reinvestment.
✅ Conclusion: Why Maruti Suzuki Deserves Investor Attention
Maruti Suzuki continues to demonstrate strong fundamentals, backed by solid revenue growth, margin expansion, and disciplined capital structure.
🔎 Investor Takeaways:
✅ Robust top-line growth (21.41% CAGR)
📈 Expanding profit margins and stable ROE
💰 Healthy EPS with stable long-term outlook
⚖️ Low leverage and strong balance sheet
💡 Cash reinvested to fund future growth
Final Word:
Maruti Suzuki India remains a dominant force in the Indian automobile sector. Its balanced growth strategy, focus on cost control, and strong financial position make it a compelling long-term investment for those betting on India’s auto market and mobility evolution.
📈Maruti Suzuki Technical Analysis: Price Charts, Trends & Potential Movements
Here, we analyze price action, support/resistance levels, moving averages, RSI, MACD, and other indicators to forecast near- and long-term movements.
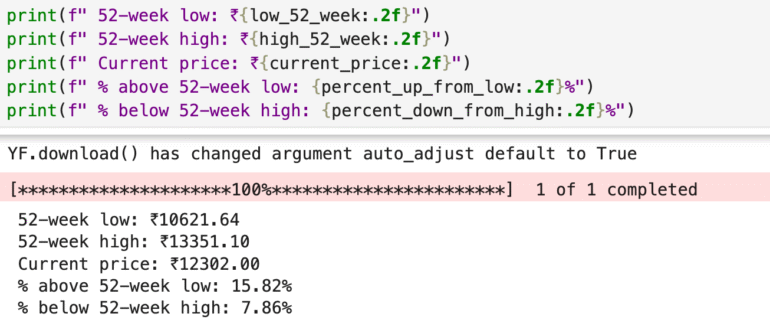
📈 Maruti Suzuki Share Performance Snapshot (2025)
🔻 52-week Low: ₹10,621.64
🔺 52-week High: ₹13,351.10
📊 Current Price: ₹12,302.00
➡️ Above 52-week Low by: +15.82%
⬅️ Below 52-week High by: -7.86%
📌 This data highlights Maruti Suzuki’s resilient performance, trading nearly 16% above its 52-week low. While still under 8% below its recent peak, the stock’s position near the upper range reflects positive market sentiment. With consistent earnings, strong demand in the auto sector, and a healthy balance sheet, Maruti Suzuki may continue its upward momentum as supply chains normalize and rural demand improves.
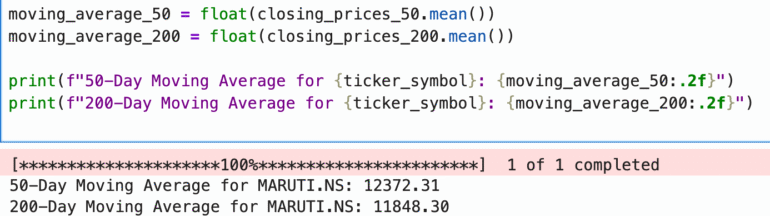
📉 Maruti Suzuki Technical Overview (2025)
📊 Current Price: ₹12,302.00
📈 50-Day Moving Average (DMA): ₹12,372.31
📉 200-Day Moving Average (DMA): ₹11,848.30
🔍 Analysis:
The current price is slightly below the 50-DMA (₹12,372.31), suggesting mild short-term consolidation or profit booking. This indicates some resistance around the 50-day average, possibly due to broader market sentiment or sector rotation.
However, the stock is well above the 200-DMA (₹11,848.30), reinforcing the strength of its long-term uptrend. The gap between the current price and the 200-DMA reflects positive momentum over the past several months.
📌 Conclusion:
Maruti Suzuki’s technical setup shows short-term resistance but long-term strength. A decisive close above the 50-DMA could reignite bullish momentum. Investors with a long-term view may consider dips as opportunities, while short-term traders may wait for confirmation above near-term resistance levels.
Competitor Check: Maruti Suzuki
Maruti Suzuki remains the undisputed king of India’s car market, thanks to its budget-friendly, fuel-efficient cars, unmatched dealer network, and trusted after-sales service. For millions of Indians, it’s still the first choice when buying a car.