
👋 Bhupendra Rawat
Stock Market Data Analyst | Programming Enthusiast | 4+ Years of Experience
Empowering insights with data & code🔍 Expertise:
- Fundamental & Technical Analysis
- Python & Pandas for Stock Data
- Interactive Financial Dashboards
- JavaScript & Chart.js Visualization
🔄 Last Updated: Analysis Based on Data Till 4 August 2025
🚀 NTPC Share Price Target 2025–2026: Powering India’s Energy Future with Stability & Scale?
NTPC, India’s largest power generation PSU, is a cornerstone of the country’s energy landscape. With a balanced portfolio of coal, gas, hydro, nuclear, and renewables, NTPC is adapting to the evolving energy ecosystem.
The share price outlook for NTPC by 2025–26 will likely be shaped by:
Ongoing expansion in renewable energy and green hydrogen
Strategic investments in battery storage and solar parks
Steady growth in revenue and net profit margins
Strong return on equity and improving debt ratios
Government’s commitment to decarbonization and energy security
As India scales up its green energy ambitions, NTPC stands out with size, stability, and execution capability. While debt-funded growth and regulatory delays could be near-term hurdles, the company’s fundamentals remain sound.
NTPC is shaping up to be a strategic long-term play in India’s energy transition. If execution aligns with policy momentum and earnings stay resilient, the stock may see gradual but steady appreciation through 2025–26 and beyond.
✅ 2026 Target View – NTPC:
If power demand slows, renewable projects face execution delays, or debt levels strain the balance sheet, NTPC’s stock could dip toward ₹290.
However, if power reforms accelerate, renewable expansion scales up, and financial performance remains stable, the stock could climb to ₹420 or more.
📉 Downside Risk: ₹290 (approx. -12%)
📈 Upside Potential: ₹420 (approx. +27%)
🔎 Note:
Stock price targets are projections, not guarantees. These estimates are based on NTPC’s financials, project execution, technical indicators, sector dynamics, and government policy support.
📊 For Short-Term / Intraday Traders:
If you want daily trading levels, live analysis, and intraday strategies for NTPC and other stocks —
join our free Telegram group, where you get professional-level market insights and trading guidance every day.
📊 NTPC Financial Overview (2021–2025)
| Year | Revenue (₹ Cr) | Growth (%) | Net Profit (₹ Cr) | Margin (%) | EPS | EPS Growth (%) | ROE (%) | Shareholders' Funds (₹ Cr) | Total Debt (₹ Cr) | D/E Ratio |
|---|---|---|---|---|---|---|---|---|---|---|
| 2021 | 111531.15 | — | 14285.53 | 12.81 | 15 | — | — | 125738.47 | 269704.03 | 2.14 |
| 2022 | 132669.28 | 18.95 | 15940.16 | 12.01 | 17 | 13.33 | 12.21 | 135373.74 | 277382.58 | 2.05 |
| 2023 | 176206.93 | 32.82 | 16341.58 | 9.27 | 17 | 0.00 | 11.57 | 147023.17 | 295067.83 | 2.01 |
| 2024 | 178500.88 | 1.30 | 19696.85 | 11.03 | 21 | 23.53 | 12.80 | 160709.27 | 315074.29 | 1.96 |
| 2025 | 188138.06 | 5.40 | 21739.44 | 11.56 | 24 | 14.29 | 12.61 | 184071.16 | 333041.91 | 1.81 |
NTPC 📊 Fundamental Analysis: Is This PSU Power Giant a Long-Term Winner?
NTPC (National Thermal Power Corporation), India’s largest power utility, plays a crucial role in the nation’s energy infrastructure. With a growing focus on renewables alongside thermal and hydro, let’s analyze NTPC’s key financial performance from FY2021 to FY2025 to assess its long-term investment attractiveness.
🔸 Revenue & Growth (CAGR: 13.96%)
NTPC has demonstrated strong revenue growth, especially post-COVID, reflecting increased power demand and improved realizations.
| Year | Revenue (₹ Cr) | Growth (%) |
|---|---|---|
| 2021 | 1,11,531.15 | — |
| 2022 | 1,32,669.28 | +18.95% |
| 2023 | 1,76,206.93 | +32.82% |
| 2024 | 1,78,500.88 | +1.30% |
| 2025 | 1,88,138.06 | +5.40% |
📈 Strong CAGR suggests a structurally growing business, though FY24 saw moderation.
🔸 Net Profit & Margins
While net profits have grown, margins have fluctuated due to rising costs and regulated tariffs.
| Year | Net Profit (₹ Cr) | Margin (%) |
|---|---|---|
| 2021 | 14,285.53 | 12.81% |
| 2022 | 15,940.16 | 12.01% |
| 2023 | 16,341.58 | 9.27% |
| 2024 | 19,696.85 | 11.03% |
| 2025 | 21,739.44 | 11.56% |
📉 Margin compression in FY23, but recovery in FY24–25 shows operating resilience.
🔸 Earnings Per Share (EPS) Growth
EPS has steadily improved, aligned with profit growth.
| Year | EPS (₹) | Growth (%) |
|---|---|---|
| 2021 | 15 | — |
| 2022 | 17 | +13.33% |
| 2023 | 17 | 0.00% |
| 2024 | 21 | +23.53% |
| 2025 | 24 | +14.29% |
✅ EPS trajectory reflects strong earnings retention and operational scale.
🔸 Return on Equity (ROE)
NTPC has maintained a healthy ROE around the 12% mark, which is strong for a PSU with heavy assets.
| Year | Net Profit (₹ Cr) | Avg. Equity (₹ Cr) | ROE (%) |
|---|---|---|---|
| 2021 | 14,285.53 | — | — |
| 2022 | 15,940.16 | 1,30,556.11 | 12.21% |
| 2023 | 16,341.58 | 1,41,198.46 | 11.57% |
| 2024 | 19,696.85 | 1,53,866.22 | 12.80% |
| 2025 | 21,739.44 | 1,72,390.22 | 12.61% |
📊 Consistent ROE indicates capital-efficient returns in a capital-heavy industry.
🔸 Debt-to-Equity Ratio
Though debt levels are high, the ratio has improved over time—suggesting better equity backing for borrowings.
| Year | Total Debt (₹ Cr) | Shareholders’ Funds (₹ Cr) | D/E Ratio |
|---|---|---|---|
| 2021 | 2,69,704.03 | 1,25,738.47 | 2.14 |
| 2022 | 2,77,382.58 | 1,35,373.74 | 2.05 |
| 2023 | 2,95,067.83 | 1,47,023.17 | 2.01 |
| 2024 | 3,15,074.29 | 1,60,709.27 | 1.96 |
| 2025 | 3,33,041.91 | 1,84,071.16 | 1.81 |
⚠️ Though D/E >1.5 is high, gradual improvement shows progress in deleveraging.
🔸 Liquidity Ratios
Liquidity position is slightly tight but consistent, showing the need for efficient working capital management.
| Year | Current Ratio | Quick Ratio |
|---|---|---|
| 2021 | 0.84 | 1.06 |
| 2022 | 0.73 | 1.16 |
| 2023 | 0.74 | 1.16 |
| 2024 | 0.69 | 1.23 |
| 2025 | 0.74 | 1.32 |
📌 Slightly below 1 for current ratio suggests reliance on short-term borrowings.
🔸 Interest Coverage Ratio (ICR)
NTPC comfortably covers its interest costs—an important marker for financial strength.
| Year | Interest Coverage Ratio |
|---|---|
| 2021 | 2.77 |
| 2022 | 3.09 |
| 2023 | 3.11 |
| 2024 | 3.12 |
| 2025 | 3.00 |
✅ Stable ICR above 3 indicates sound ability to service debt.
🔸 Return on Capital Employed (ROCE)
ROCE has hovered near 9%—a decent level for infrastructure-heavy companies.
| Year | ROCE (%) |
|---|---|
| 2021 | 7.90 |
| 2022 | 8.35 |
| 2023 | 9.46 |
| 2024 | 9.48 |
| 2025 | 9.13 |
📉 Though not exceptional, stable ROCE highlights NTPC’s consistent asset use.
✅ Conclusion: Dominant Utility With Predictable Growth
Strengths:
Strong revenue and profit CAGR
Consistent EPS and ROE
Government-backed monopoly power supplier
Improving debt profile and stable ICR
Risks:
High capital intensity, moderate ROCE
Slightly tight liquidity ratios
Regulated pricing may limit margin expansion
📌 Verdict: NTPC is a large, reliable PSU with consistent performance and a gradual shift toward renewables. For long-term investors seeking stable returns, it’s a solid bet—especially when bought at attractive valuations.
📈SJVN Technical Analysis: Price Charts, Trends & Potential Movements
Here, we analyze price action, support/resistance levels, moving averages, RSI, MACD, and other indicators to forecast near- and long-term movements.
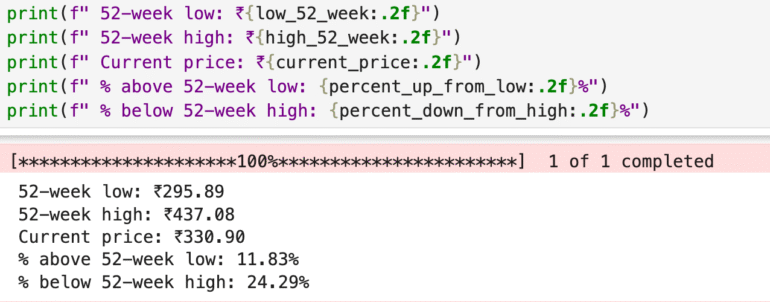
📈 NTPC 52-Week Price Performance Snapshot
52-Week Low: ₹295.89
52-Week High: ₹437.08
Current Market Price: ₹330.90
NTPC’s stock is currently 11.83% above its 52-week low, showing some upward momentum from recent support levels. However, it still trades 24.29% below its 52-week high, indicating potential upside if market conditions and earnings improve.
📊 Interpretation:
The current price positioning suggests NTPC may be in a consolidation phase after hitting its yearly peak. For long-term investors, this zone could be seen as a strategic accumulation opportunity, especially with the company’s stable earnings, government backing, and increasing focus on renewables. Monitoring sector reforms and coal cost trends will be key.
Lorem ipsum dolor sit amet, consectetur adipiscing elit. Ut elit tellus, luctus nec ullamcorper mattis, pulvinar dapibus leo.
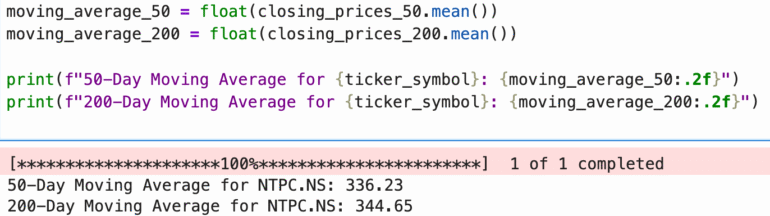
📊 NTPC Moving Averages Analysis
50-Day Moving Average (MA): ₹336.23
200-Day Moving Average (MA): ₹344.65
Current Market Price (CMP): ₹330.90
📉 Technical Insight:
NTPC’s current price is below both the 50-day and 200-day moving averages.
➡️ This reflects short-term and long-term weakness in the stock trend.
➡️ Staying below the 50-DMA indicates bearish sentiment in the near term.
➡️ A move above the 200-DMA would signal a bullish trend reversal for long-term investors.
📌 Conclusion:
NTPC appears to be in a consolidation or corrective phase. Traders may consider avoiding fresh long positions until the stock breaks above the 50-DMA. For long-term investors, a sustained move above the 200-DMA could act as a technical confirmation of a renewed uptrend.
🔍 Competitor Analysis: How NTPC Stacks Up
While NTPC is India’s largest and most reliable power generator with a strong focus on renewables and consistent dividends, it’s important to compare it with other key players in the sector:
Power Grid Share Price Target 2025 – A stable, government-backed transmission giant known for steady returns and low volatility.
Adani Power Share Price Target 2025 – A high-growth private thermal power player benefiting from rising demand and operational efficiency.
SJVN Share Price Target 2025 – A public sector company focused on hydro and renewable energy, positioning itself as a major player in India’s clean energy future.
✅ Comparing these companies helps investors understand where NTPC stands in terms of stability, long-term growth, and sector leadership.