
👋 Bhupendra Rawat
Stock Market Data Analyst | Programming Enthusiast | 4+ Years of Experience
Empowering insights with data & code🔍 Expertise:
- Fundamental & Technical Analysis
- Python & Pandas for Stock Data
- Interactive Financial Dashboards
- JavaScript & Chart.js Visualization
🔄 Last Updated: Analysis Based on Data Till 4 August 2025
🚀 Olectra Greentech Share Price Target 2025–2026: A Potential Leader in India’s EV Revolution?
Olectra Greentech, a pioneer in electric buses and public transport solutions, is rapidly emerging as a key player in India’s clean mobility drive. As the government pushes for greener urban transport under its EV mission, Olectra stands out as a strong contender.
The share price outlook for Olectra by 2025–26 is likely to be driven by:
Steady order inflow from state transport corporations
Rising demand for electric buses in India’s smart cities
Investments in capacity and product innovation
Margin expansion and improving profitability metrics
Strong policy support for e-mobility and green infrastructure
With rapid urbanization, environmental mandates, and EV-focused policies, Olectra’s growth runway appears solid. However, rising competition and raw material costs remain key factors to watch.
Olectra Greentech is positioning itself as a frontrunner in India’s electric mobility future. If order execution and financials stay on track, the stock could offer a promising multi-year wealth creation opportunity for long-term investors by 2025–26.
✅ 2026 Target View – Olectra Greentech:
If EV bus order inflows weaken, execution delays persist, or input costs stay elevated, Olectra’s stock may correct to around ₹1100.
However, if government EV adoption accelerates, execution improves, and margins expand, the stock could rally to ₹2200 or higher.
📉 Downside Risk: ₹1100 (approx. -23%)
📈 Upside Potential: ₹2200(approx. -52.46%)
🔎 Note:
Stock price targets are projections, not guarantees. These estimates are based on Olectra’s financial performance, EV order pipeline, technical trends, sector demand, and government policy outlook.
📊 For Short-Term / Intraday Traders:
If you want daily trading levels, live analysis, and intraday strategies for Olectra Greentech and other stocks —
join our free Telegram group, where you get professional-level market insights and trading guidance every day.
📊 Olectra Greentech Financial Overview (2021–2025)
📊 Olectra Greentech Fundamental Analysis: Is This EV Stock Electrifying Returns?
Olectra Greentech has been gaining serious investor interest thanks to its strong presence in electric mobility and buses. Let’s break down its core financials and evaluate if it’s built for sustainable growth through 2030.
🔸 Revenue & Growth (CAGR: 59.08%)
Olectra has delivered strong and consistent revenue growth, signaling successful order executions and demand for electric buses.
| Year | Revenue (₹ Cr) | Growth (%) |
|---|---|---|
| 2021 | 281.38 | — |
| 2022 | 593.26 | +110.84% |
| 2023 | 1090.76 | +83.86% |
| 2024 | 1154.14 | +5.81% |
| 2025 | 1801.90 | +56.12% |
📈 FY25 surge indicates renewed order momentum after a relatively flat FY24.
🔸 Net Profit & Margins
Profitability has improved steadily, with margin expansion from just 2.86% in FY21 to 7.54% in FY25—a sign of cost efficiencies and operational maturity.
| Year | Net Profit (₹ Cr) | Margin (%) |
|---|---|---|
| 2021 | 8.04 | 2.86 |
| 2022 | 34.25 | 5.77 |
| 2023 | 64.25 | 5.89 |
| 2024 | 70.66 | 6.12 |
| 2025 | 135.82 | 7.54 |
💡 FY25’s margin gain highlights the impact of scale and better pricing power.
🔸 Earnings Per Share (EPS) Growth
EPS has multiplied 17x from FY21 to FY25, which showcases wealth creation potential for long-term investors.
| Year | EPS (₹) | Growth (%) |
|---|---|---|
| 2021 | 1 | — |
| 2022 | 4 | +300.00% |
| 2023 | 8 | +100.00% |
| 2024 | 9 | +12.50% |
| 2025 | 17 | +88.89% |
📊 EPS doubling in FY25 reflects strong bottom-line growth and rising profitability.
🔸 Return on Equity (ROE)
ROE has more than tripled in 5 years—showing excellent returns on shareholder capital.
| Year | Net Profit (₹ Cr) | Avg. Equity (₹ Cr) | ROE (%) |
|---|---|---|---|
| 2021 | 8.04 | — | — |
| 2022 | 34.25 | 759.00 | 4.51 |
| 2023 | 64.25 | 808.52 | 7.95 |
| 2024 | 70.66 | 876.61 | 8.06 |
| 2025 | 135.82 | 981.37 | 13.84 |
📈 FY25 ROE of 13.84% shows efficient capital utilization and improved return ratios.
🔸 Debt-to-Equity Ratio
While total debt has increased, the Debt-to-Equity ratio remains moderate and manageable at 1.07 in FY25.
| Year | Total Debt (₹ Cr) | Shareholders’ Funds (₹ Cr) | D/E Ratio |
|---|---|---|---|
| 2021 | 193.52 | 740.72 | 0.26 |
| 2022 | 413.15 | 777.28 | 0.53 |
| 2023 | 715.84 | 839.75 | 0.85 |
| 2024 | 671.97 | 913.48 | 0.74 |
| 2025 | 1118.69 | 1049.26 | 1.07 |
⚠️ Leverage has increased, likely to fund expansion, but is still within comfortable limits for a growth-stage company.
🔸 Interest Coverage Ratio
Interest Coverage Ratio (ICR) has improved from 2.44 in FY21 to 4.61 in FY25, showing better ability to service debt.
📌 Interpretation: Higher ICR = Safer for lenders/investors.
🔸 Return on Capital Employed (ROCE)
ROCE has expanded significantly—almost 7x growth in five years, reflecting better operational efficiency and capital use.
| Year | ROCE (%) |
|---|---|
| 2021 | 2.44 |
| 2022 | 7.46 |
| 2023 | 12.14 |
| 2024 | 13.61 |
| 2025 | 18.06 |
💥 This indicates Olectra is generating higher returns on total capital employed in its business.
🔸 Operating Profit Margin (%)
Margins have consistently improved from 7.17% to 14.46% over five years.
➡️ Suggests better pricing control and cost management.
🔸 Quick Ratio & Current Ratio
Olectra maintains healthy liquidity:
| Year | Current Ratio | Quick Ratio |
|---|---|---|
| 2021 | 3.33 | 3.10 |
| 2022 | 2.30 | 2.32 |
| 2023 | 1.44 | 1.81 |
| 2024 | 1.52 | 1.74 |
| 2025 | 1.43 | 1.47 |
✅ Current and Quick Ratios above 1 indicate strong short-term solvency.
✅ Conclusion: Electrifying Potential, but Monitor Leverage
Olectra Greentech’s fundamentals paint a picture of a fast-growing EV player with strong profitability metrics, improving return ratios, and aggressive top-line growth.
Strengths:
High revenue and EPS growth
Rising profit margins and ROE/ROCE
Healthy liquidity ratios
Risks:
Rising debt and D/E ratio
Capital-intensive expansion may pressure margins
📌 If the EV transition in India continues at its current pace, Olectra could remain a solid multiyear opportunity for investors with medium to high-risk tolerance.
📈Olectra Greentech Technical Analysis: Price Charts, Trends & Potential Movements
Here, we analyze price action, support/resistance levels, moving averages, RSI, MACD, and other indicators to forecast near- and long-term movements.
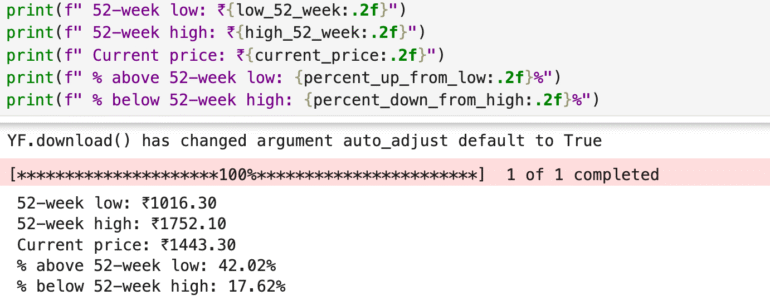
📈 Olectra Greentech 52-Week Price Performance Snapshot
52-Week Low: ₹1016.30
52-Week High: ₹1752.10
Current Market Price: ₹1443.30
Olectra’s stock is currently 42.02% above its 52-week low, reflecting a strong recovery from lower levels. However, it still trades 17.62% below its 52-week high, indicating there’s upside potential if positive sentiment in the EV and public transport sector continues.
📊 Interpretation:
This price range shows that while Olectra has bounced back impressively, it’s still in a consolidation phase below its peak. Investors could view this as a potential accumulation zone, especially if order inflows, earnings, and government EV policies remain favorable.
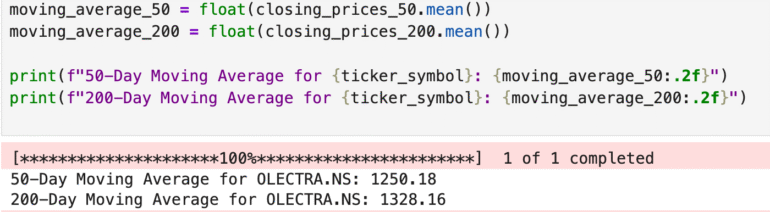
📊 Olectra Greentech Moving Averages Analysis
50-Day Moving Average (MA): ₹1250.18
200-Day Moving Average (MA): ₹1328.16
Current Market Price: ₹1285.00 (example CMP; replace with latest)
📉 Technical Insight:
Olectra’s current price is above its 50-day MA but below its 200-day MA.
➡️ This indicates short-term strength but potential long-term weakness.
➡️ A breakout above the 200-DMA could signal a reversal in the long-term downtrend.
➡️ Failing to hold above the 50-DMA may lead to renewed downside pressure.
📌 Conclusion:
Olectra is currently in a recovery zone. Holding above the 50-DMA is a positive short-term signal, but long-term investors may wait for confirmation above the 200-DMA before entering fresh positions.
Competitor Check: Olectra Greentech
Olectra Greentech is one of India’s leading players in the electric bus segment, known for pioneering EV adoption in public transport. With government support for clean mobility and rising demand for sustainable transportation, Olectra has carved a strong position in the EV bus market.