
👋 Bhupendra Rawat
Stock Market Data Analyst | Programming Enthusiast | 4+ Years of Experience
Empowering insights with data & code🔍 Expertise:
- Fundamental & Technical Analysis
- Python & Pandas for Stock Data
- Interactive Financial Dashboards
- JavaScript & Chart.js Visualization
🔄 Last Updated: Analysis Based on Data Till 1 August 2025
🚆 RVNL Share Price Target 2025–2026: Is It a Strong Bet for the Long Term?
Rail Vikas Nigam Limited (RVNL) is a public sector enterprise under the Ministry of Railways, actively involved in key railway infrastructure projects such as electrification, track doubling, and station redevelopment. With India’s rapid expansion in railway infrastructure and metro networks, RVNL’s role and order book continue to strengthen.
The share price target for RVNL by 2025–26 will depend on several key factors:
Rising government capital expenditure (Capex) on railways
New projects like metros, high-speed rail, and modernization
The company’s financial growth and profitability
Technical chart patterns and brokerage ratings
Declining debt and a strong order book make RVNL a promising long-term candidate; however, the recent drop in ROE warrants attention.
✅ 2026 Target View – RVNL:
RVNL’s stock may fall to around ₹300 if execution delays, lower government capex, or sector-wide weakness emerge. However, if project momentum continues and new railway infrastructure orders stay robust, the stock could surge toward ₹450.
📉 Downside Risk: ₹300 (≈ -14%)
📈 Upside Potential: ₹450+
🔎 Note:
Stock price forecasting is not absolute. Analysts evaluate a mix of company fundamentals, technical trends, and macro factors to arrive at these indicative targets.
🔄 Last Updated: Analysis Based on Data Till 1 August 2025
📊 RVNL Financial Overview (2021–2025)
📊 RVNL Fundamental Analysis: Evaluating the Core Strength of the Company
This section dives into revenue growth, net profit, EPS, ROE, debt-to-equity, and other key financial metrics to understand long-term stability.
🔸 Revenue & Growth
RVNL’s total revenue grew from ₹15,403 Cr in 2021 to ₹21,889 Cr in 2024, before slightly declining to ₹19,923 Cr in 2025. This reflects a mix of strong early momentum followed by some recent slowdown.
➡️ 2021: ₹15,403.76 Cr
➡️ 2022: ₹19,381.71 Cr (+25.82%)
➡️ 2023: ₹20,281.57 Cr (+4.64%)
➡️ 2024: ₹21,889.23 Cr (+7.93%)
➡️ 2025: ₹19,923.01 Cr (−8.98%)
📉 A dip in 2025 may be attributed to project delays or reduced Capex inflows.
🔸 Net Profit & Margins
Despite revenue fluctuations, RVNL maintained consistent profitability with margins hovering around 6%. This shows healthy cost control and execution efficiency.
➡️ 2021: ₹922.85 Cr (Margin: 5.99%)
➡️ 2022: ₹1,079.17 Cr (5.57%)
➡️ 2023: ₹1,261.95 Cr (6.22%)
➡️ 2024: ₹1,574.47 Cr (7.19%)
➡️ 2025: ₹1,186.11 Cr (5.95%)
🔸 EPS & Growth
Earnings Per Share (EPS) rose steadily from ₹4 to ₹8 until 2024, followed by a dip in 2025 — possibly due to earnings contraction.
➡️ 2021: ₹4
➡️ 2022: ₹6 (+50%)
➡️ 2023: ₹7 (+16.67%)
➡️ 2024: ₹8 (+14.29%)
➡️ 2025: ₹6 (−25%)
📊 This decline could be temporary, tied to revenue moderation.
🔸 ROE (Return on Equity)
RVNL’s ROE remained strong, reflecting effective capital use until FY24. The dip in FY25 may be due to reduced profitability.
➡️ FY22: 18.04%
➡️ FY23: 18.39%
➡️ FY24: 19.59%
➡️ FY25: 12.95%
🔸 Debt-to-Equity Ratio
Debt levels have declined steadily, improving RVNL’s leverage profile — a positive sign for long-term investors.
➡️ FY21: 1.54
➡️ FY22: 2.11
➡️ FY23: 1.51
➡️ FY24: 1.24
➡️ FY25: 1.14
📉 A decreasing debt-to-equity ratio shows better financial discipline and risk management.
📌 Conclusion
RVNL remains a fundamentally strong PSU in the infrastructure sector. While FY25 shows short-term softness in revenue and EPS, the overall long-term trajectory is supported by:
Strong order book
Steady margins
Government Capex
Decreasing debt
✅ If India’s railway and metro infrastructure push continues, RVNL can remain a strong long-term investment bet till 2026.
📈RVNL Technical Analysis: Price Charts, Trends & Potential Movements
Here, we analyze price action, support/resistance levels, moving averages, RSI, MACD, and other indicators to forecast near- and long-term movements.
📊 Price Positioning Overview
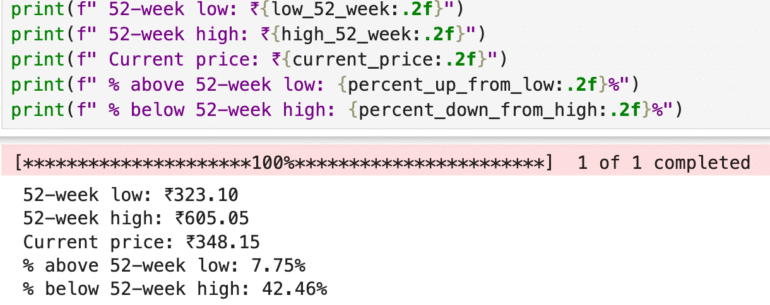
52-Week Low: ₹323.10
52-Week High: ₹605.05
Current Price: ₹348.15
✅ Above 52-Week Low by: 7.75%
❌ Below 52-Week High by: 42.46%
➡️ The stock is trading close to its 52-week low and significantly below its high, which may indicate either a value-buying opportunity or market weakness — depending on fundamentals and technicals.
📉 Moving Averages – RVNL
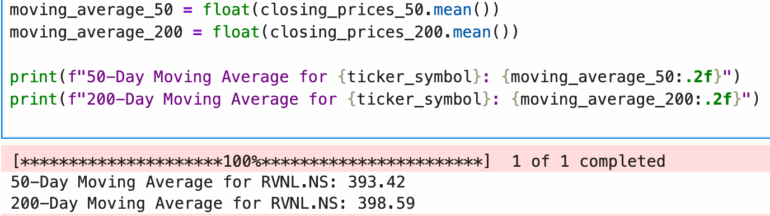
🟡 50-Day Moving Average: ₹393.42
🔵 200-Day Moving Average: ₹398.59
➡️ Since the current price is ₹348.15, the stock is trading below both the 50-day and 200-day moving averages, which is typically considered a bearish signal.
👉 This indicates that the stock may be in a downtrend or under selling pressure. Traders and investors might view this as a potential support zone or wait for further confirmation before making a move.
🔍 Competitor Analysis: How RVNL Stacks Up
Rail Vikas Nigam Limited (RVNL), a government-backed railway infrastructure company, has gained investor attention due to its consistent project execution, strong order pipeline, and asset-light model. But to evaluate its true position in India’s infrastructure sector, it’s important to compare it with key peers:
L&T Share Price Target 2025–2026 – India’s infrastructure behemoth with diversified operations in engineering, defence, heavy industries, and global projects. Offers scale, stability, and long-term value.
NBCC Share Price Target 2025–2026 – Specializes in project management and urban redevelopment with a strong government client base and consistent cash flows.
✅ Comparing these companies helps investors understand RVNL’s niche strength in rail projects, cost-efficiency, and PSU backing, while assessing how it fares against larger and more diversified players in terms of growth potential, risk exposure, and long-term sustainability.